Free Access
Fig. 7.
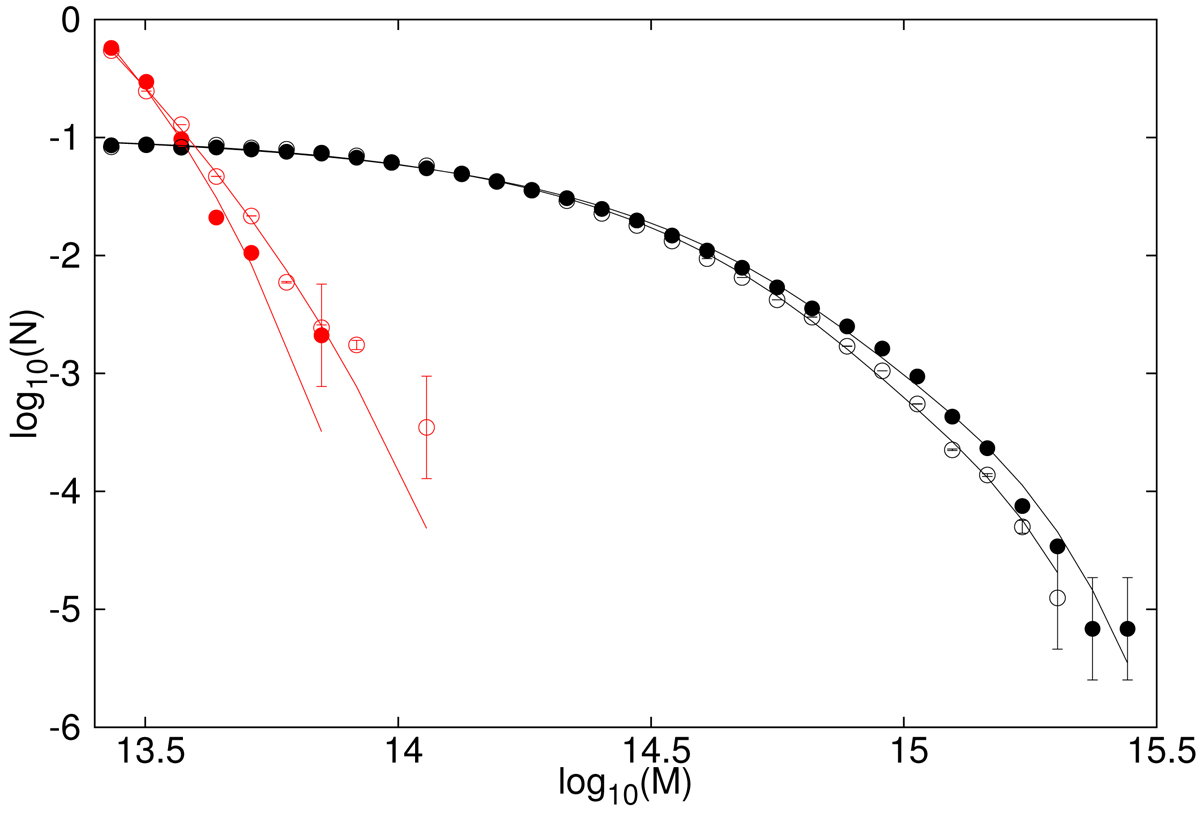
Halo abundances for the two extreme different isolation status, 1 < Risol/rvir < 4 (black) and 40 < Risol/rvir < 50 (red). The lower redshift range z < 0.456 is indicated with filled symbols, and the higher redshift range, z∈ (0.456, 0.625), with open symbols. The AFs are normalized to the same total number.
Current usage metrics show cumulative count of Article Views (full-text article views including HTML views, PDF and ePub downloads, according to the available data) and Abstracts Views on Vision4Press platform.
Data correspond to usage on the plateform after 2015. The current usage metrics is available 48-96 hours after online publication and is updated daily on week days.
Initial download of the metrics may take a while.