Fig. 4.
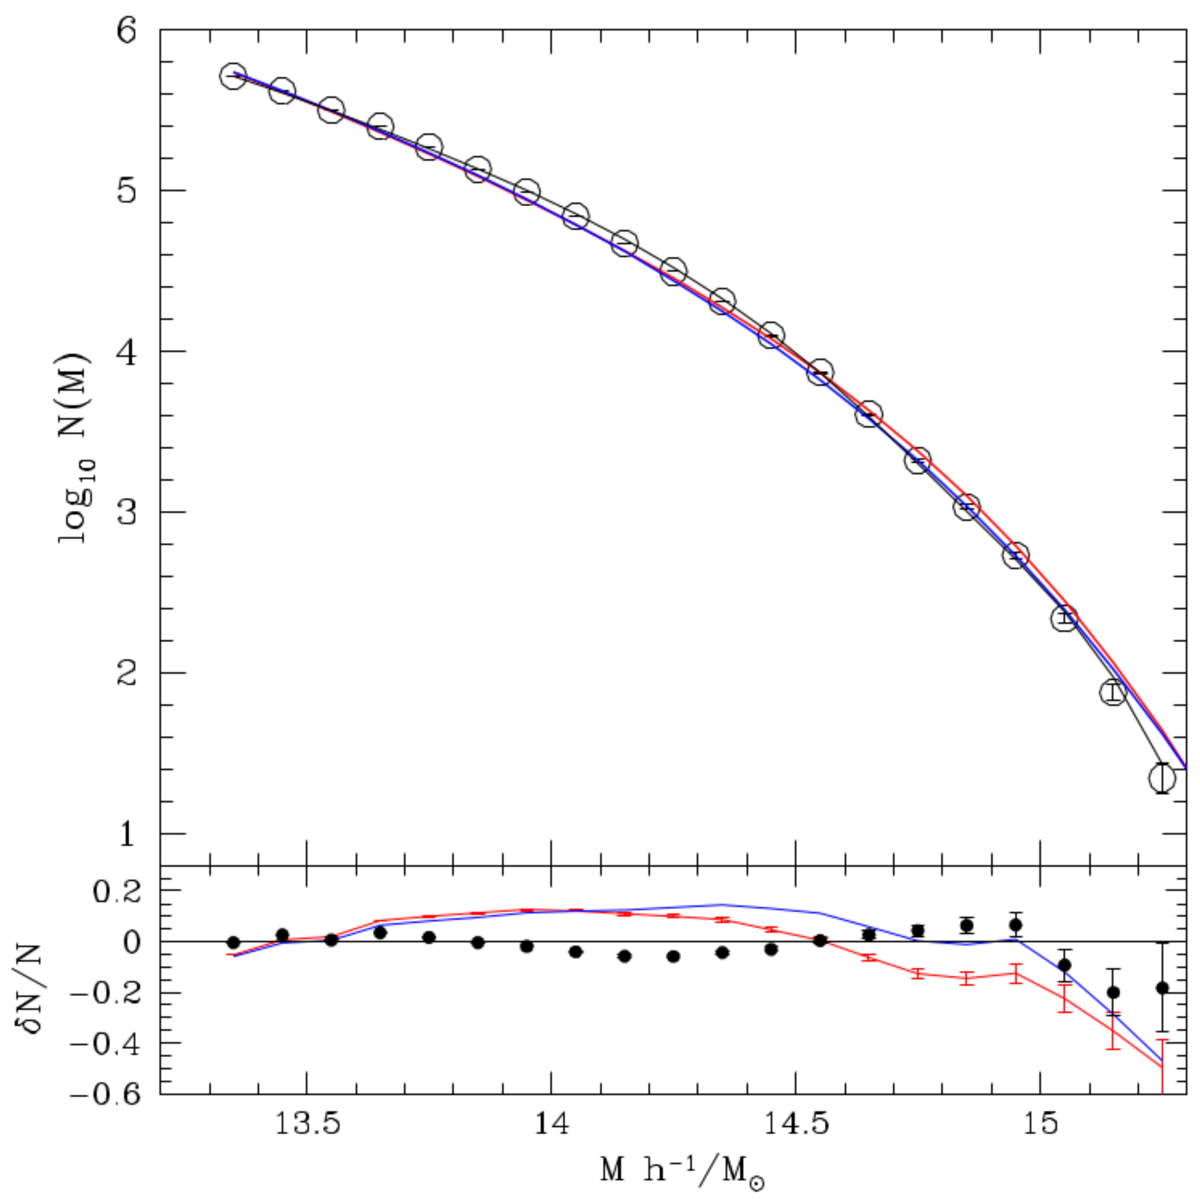
Empty points represent the light-cone halo N(M), the red curve shows the volume-integrated Reed et al. (2007) Φ(M, z), the blue line shows the Jenkins et al. (2001) Φ(M, z), and the black curve represents the double power-law Schecther function. The lower panel shows the relative deviations of the three models from the data N(M), with the filled black points representing the deviation of our Schechter-like function. It is evident that the latter functional form represents the data better. The two theoretical Φ(M, z) are the best fits to the halo data from six models.
Current usage metrics show cumulative count of Article Views (full-text article views including HTML views, PDF and ePub downloads, according to the available data) and Abstracts Views on Vision4Press platform.
Data correspond to usage on the plateform after 2015. The current usage metrics is available 48-96 hours after online publication and is updated daily on week days.
Initial download of the metrics may take a while.