Fig. 7
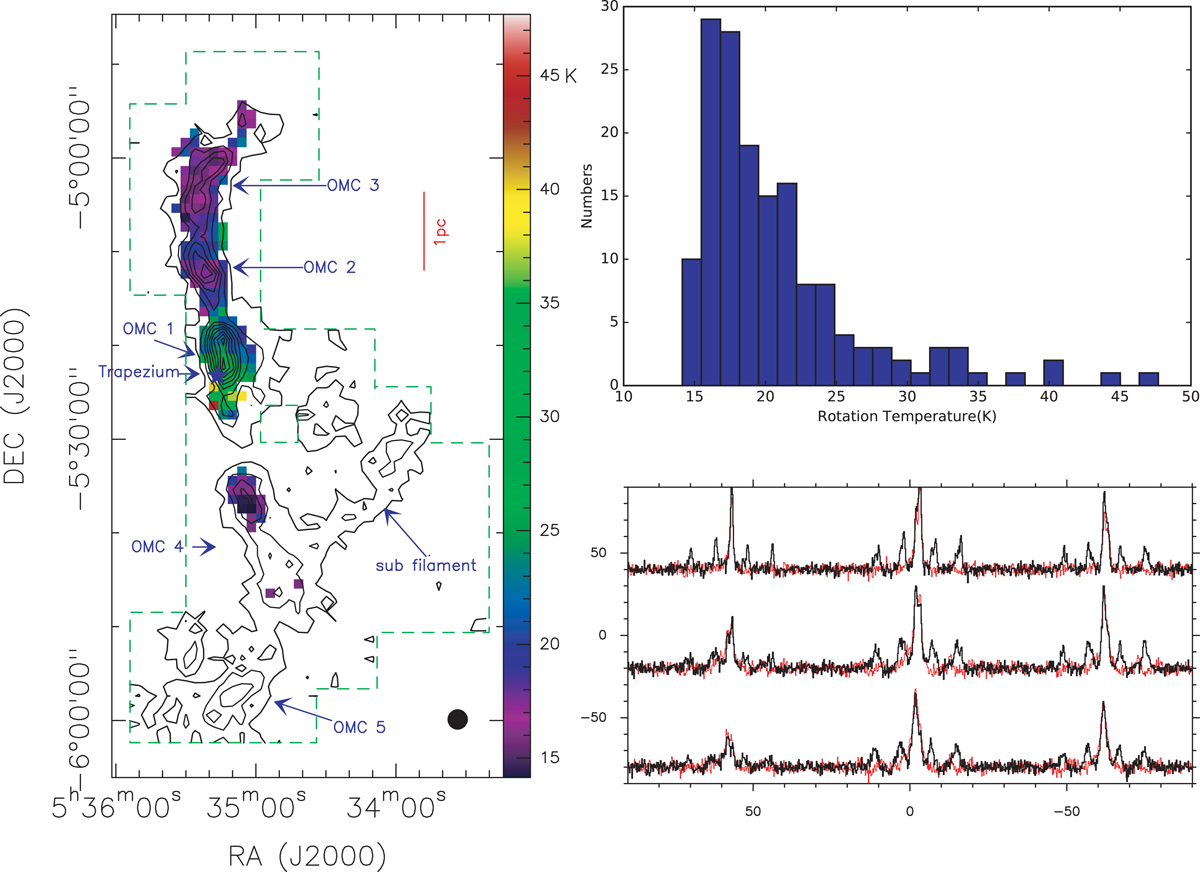
Left panel: temperature distribution along the ISF overlaid with integrated intensity contours as in the left panel of Fig. 1. Most of the temperatures are about or below 20 K. Temperatures exceed 40 K at several positions. There the NH3 (2, 2) lines are even stronger than those of NH3 (1, 1) (see the lower right panel). Top right panel: histogram of the rotation temperatures derived from NH3. Lower right panel: the NH3 (1, 1) (black profiles) and NH3 (2, 2) (red profiles) spectra around the Trapezium. The reference position corresponds to RA: 05:35:14, DEC: −05:22:24(J2000), the spacing is one arcminute.
Current usage metrics show cumulative count of Article Views (full-text article views including HTML views, PDF and ePub downloads, according to the available data) and Abstracts Views on Vision4Press platform.
Data correspond to usage on the plateform after 2015. The current usage metrics is available 48-96 hours after online publication and is updated daily on week days.
Initial download of the metrics may take a while.