Fig. 5
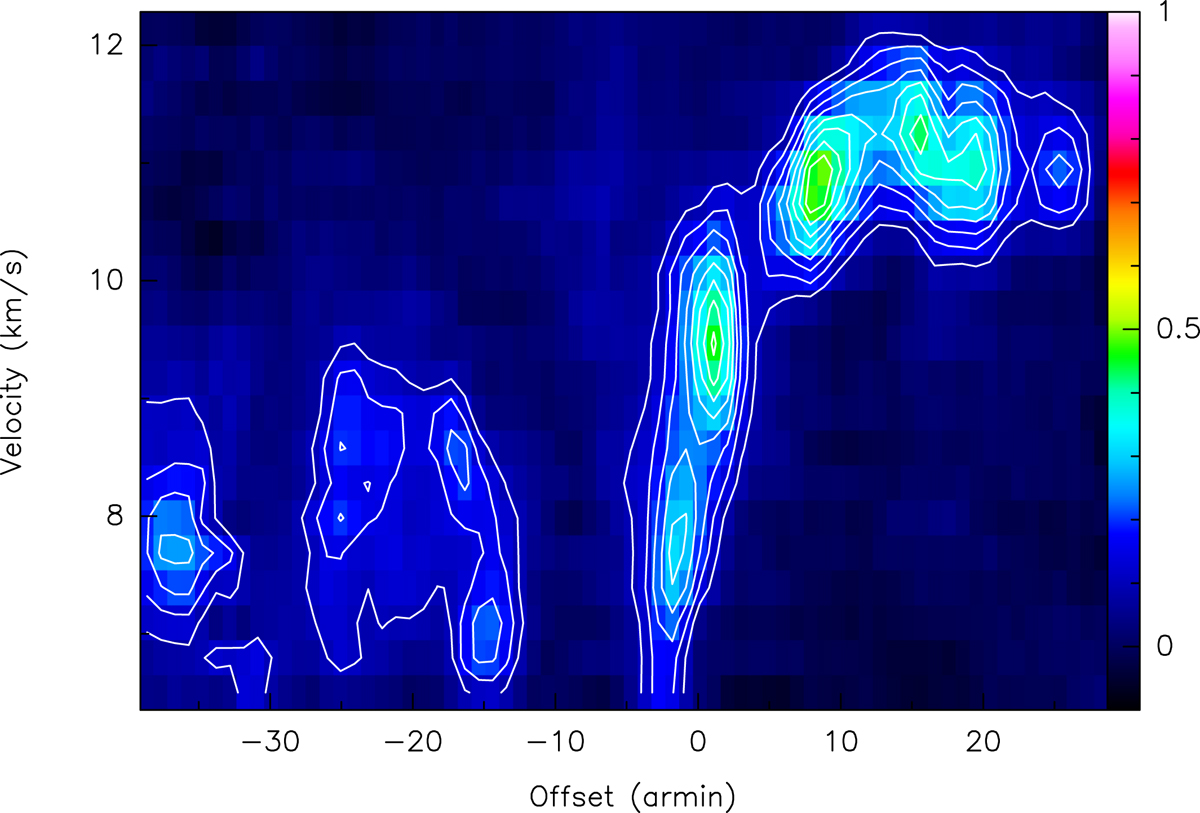
Position-velocity (PV) diagram of the NH3 (1, 1) main line along the gray solid poly-line in the left panel of Fig. 3. The cut runs through the ISF with negative offsets referring to the southern part of the filament. Offset 0 refers to the location of the Trapezium cluster. The threshold and step of the contours of the position-velocity diagram are all 10% of the peak flux.
Current usage metrics show cumulative count of Article Views (full-text article views including HTML views, PDF and ePub downloads, according to the available data) and Abstracts Views on Vision4Press platform.
Data correspond to usage on the plateform after 2015. The current usage metrics is available 48-96 hours after online publication and is updated daily on week days.
Initial download of the metrics may take a while.