Fig. 3
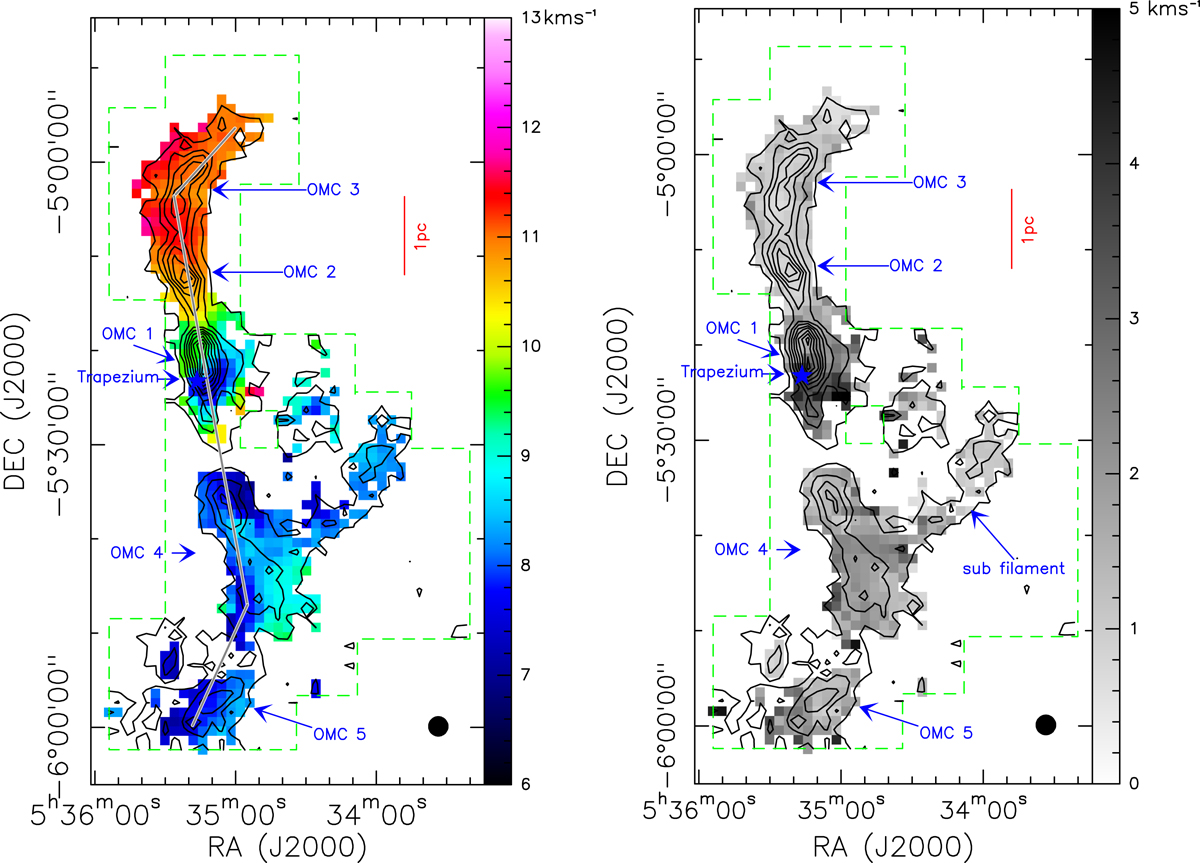
Kinematics of the ISF derived from NH3 (1, 1). Left panel: velocity map (color image) of the ISF. Right panel: FWHM line width map (gray image) of the ISF. Contours in each panel are the same as in the left panel of Fig. 1. The gray solid polyline in the left panel indicates the loci for the position-velocity diagram presented in Fig. 5.
Current usage metrics show cumulative count of Article Views (full-text article views including HTML views, PDF and ePub downloads, according to the available data) and Abstracts Views on Vision4Press platform.
Data correspond to usage on the plateform after 2015. The current usage metrics is available 48-96 hours after online publication and is updated daily on week days.
Initial download of the metrics may take a while.