Fig. 2
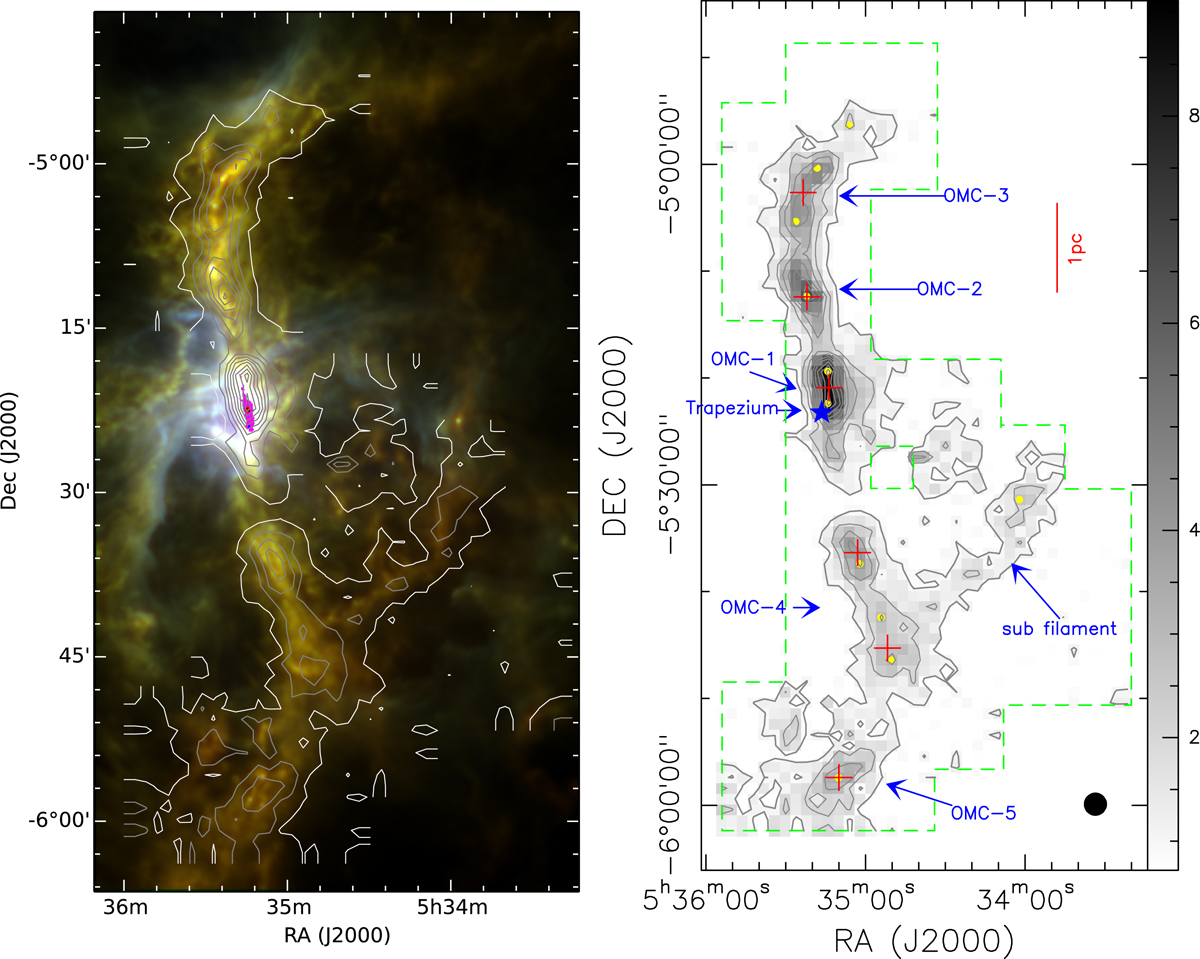
Left panel: false color image of the ISF (red for 500 μm, green for 250 μm, and blue for 100 μm, all Herschel data) overlaid with NH3 (1, 1) integrated intensity contours, as in Fig. 1. Right panel: “clumps” and “sub-clumps” are labeled as red crosses and yellow filled circles, respectively, on the NH3 (1, 1) integrated intensity map.
Current usage metrics show cumulative count of Article Views (full-text article views including HTML views, PDF and ePub downloads, according to the available data) and Abstracts Views on Vision4Press platform.
Data correspond to usage on the plateform after 2015. The current usage metrics is available 48-96 hours after online publication and is updated daily on week days.
Initial download of the metrics may take a while.