Fig. C.1.
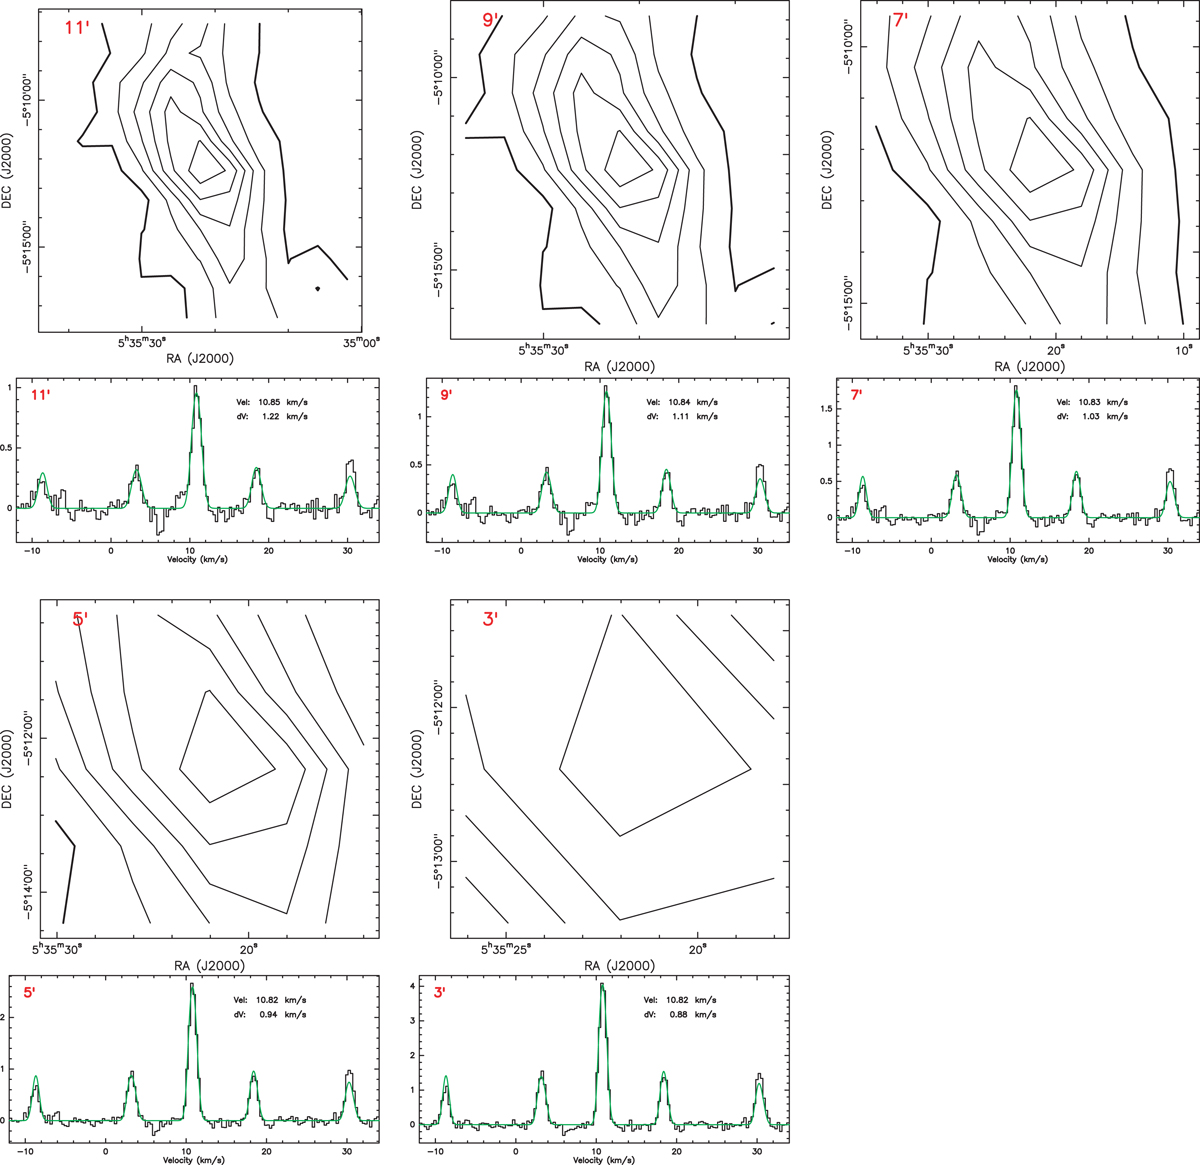
From left to right and top to bottom, the contours are the integrated intensity (zeroth moment) maps of NH3 (1, 1) with side lengths of 11′, 9′, 7′, 5′, and 3′ respectively. These images are all centered at the red cross in OMC-2 illustrated in the right panel of Fig. 2. The integration range of each panel is 6.5 < VLSR < 12.5 km s−1. Contours start at 0.96 K km s−1 (4σ) and go up in steps of 0.96 K km s−1. The spectra (black) overlaid with their fitting curves (green) are the averaged spectra within the regions corresponding to their upper panels.
Current usage metrics show cumulative count of Article Views (full-text article views including HTML views, PDF and ePub downloads, according to the available data) and Abstracts Views on Vision4Press platform.
Data correspond to usage on the plateform after 2015. The current usage metrics is available 48-96 hours after online publication and is updated daily on week days.
Initial download of the metrics may take a while.