Fig. 1.
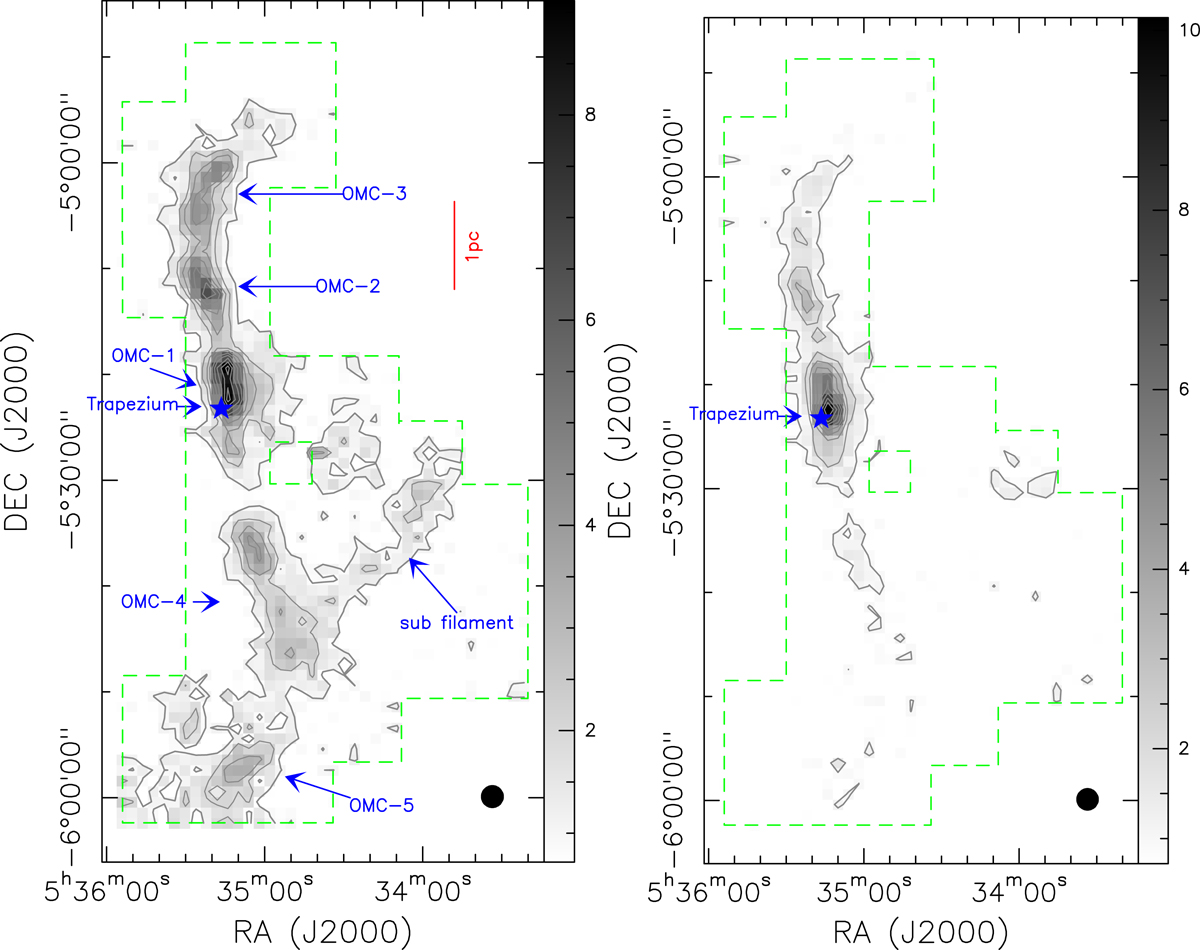
Integrated intensity (zeroth moment) maps of NH3 (1, 1) (left) and (2, 2) (right). The integration range of each panel is 6.5 < VLSR < 12.5 km s−1. Contours start at 0.96 K km s−1 (4σ) on a main beam brightness temperature scale and go up in steps of 0.96 K km s−1. The limits of the mapped region are indicated with green dashed lines. A blue star in each panel indicates the Trapezium cluster and black filled circles in the lower right illustrate the half-power beam size.
Current usage metrics show cumulative count of Article Views (full-text article views including HTML views, PDF and ePub downloads, according to the available data) and Abstracts Views on Vision4Press platform.
Data correspond to usage on the plateform after 2015. The current usage metrics is available 48-96 hours after online publication and is updated daily on week days.
Initial download of the metrics may take a while.