Fig. 2.
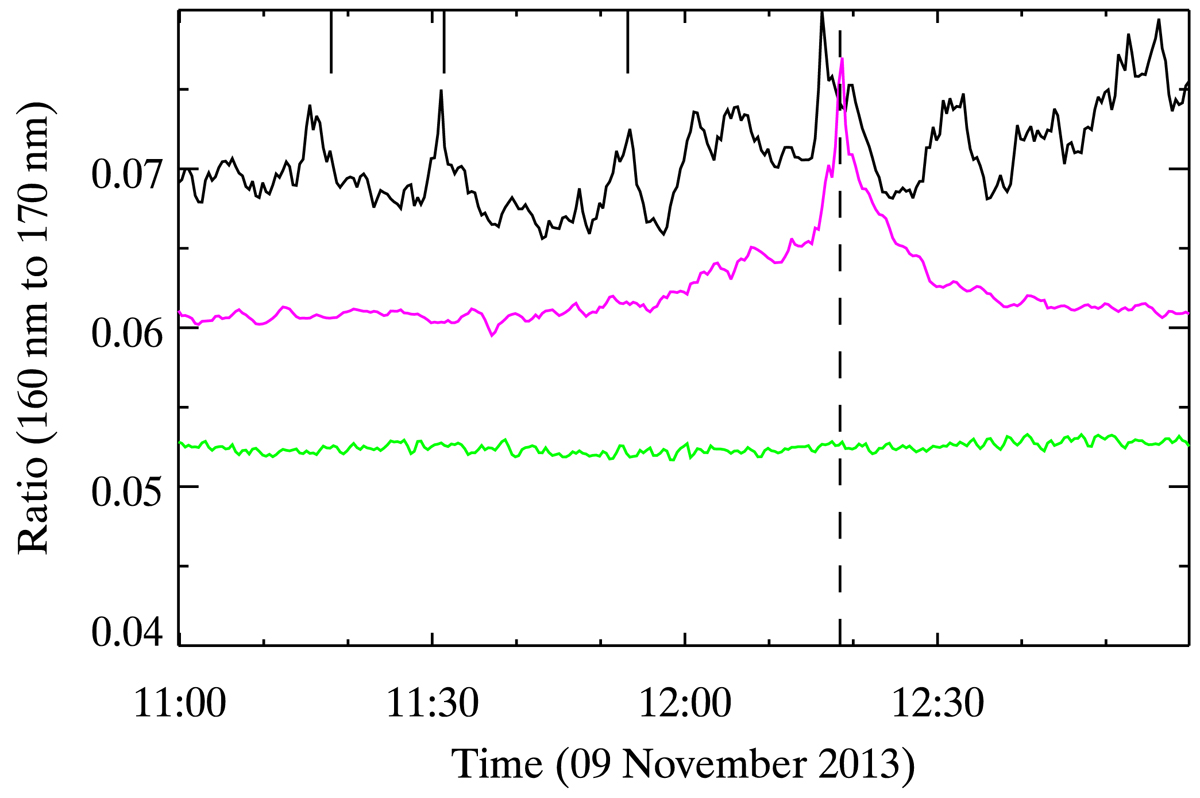
As in Fig. 1(b) but for the ratios of 160 nm and 170 nm AIA filters. The green curve representing a quiet Sun region adjacent to the AR shows the comparison with the ratios from the footpoint regions (black and magenta, cf. Fig. 1). The short vertical bars and the vertical dashed line denote the same time-stamps as in Fig. 1(b). See Sect. 3 for details.
Current usage metrics show cumulative count of Article Views (full-text article views including HTML views, PDF and ePub downloads, according to the available data) and Abstracts Views on Vision4Press platform.
Data correspond to usage on the plateform after 2015. The current usage metrics is available 48-96 hours after online publication and is updated daily on week days.
Initial download of the metrics may take a while.