Fig. 1.
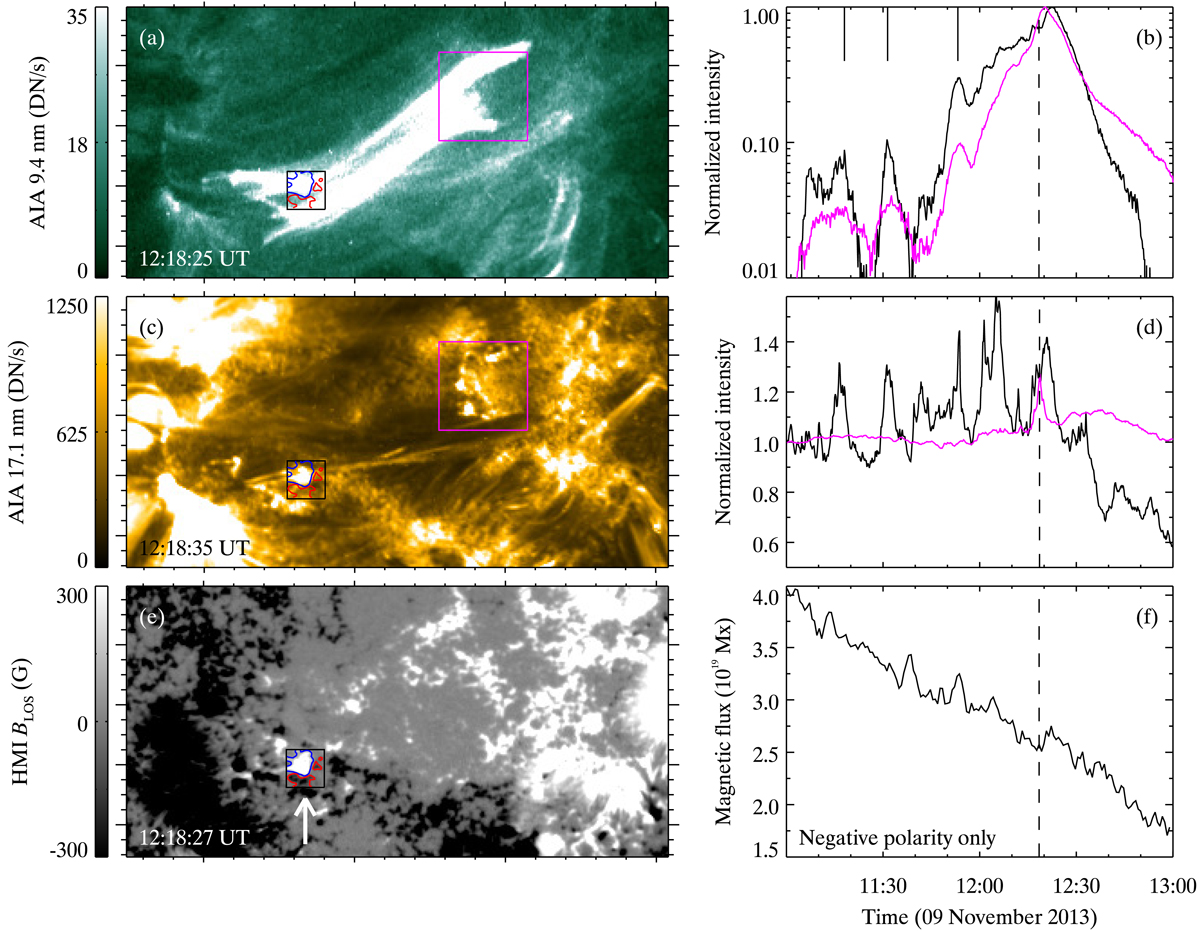
Hot core loop in AR 11890 and its association with the cancellation of surface magnetic flux. Panel a: AIA 9.4 nm filter image showing a fully formed coronal loop seen from almost directly above. The black (east) and magenta (west) boxes mark the regions near the footpoints. The field of view is 180″ × 90″. Panel b: AIA 9.4 nm light curves from the footpoint regions. The short vertical bars point to the near-simultaneous peaks in the two light curves. Panels c and d: as in panels a and b: but with the AIA 17.1 nm filter. Panel e: HMI line-of-sight magnetic field map, in which darker shading represents negative polarity and lighter shading positive polarity field. The black box encloses magnetic flux near the eastern footpoint of the loop; it lies at the same position as the black boxes in panels a and c. The blue (positive polarity) and red (negative polarity) contours within this box cover regions with a magnetic flux density of ±75 G or more (see also panels a and c). Panel f Magnetic flux of the negative polarity near the eastern footpoint as a function of time (see arrow). The vertical dashed line in the right panels marks the time-stamp of the corresponding spatial maps displayed on the left. See online movie to follow the evolution of this loop brightening. North is up. See Sect. 3 for details.
Current usage metrics show cumulative count of Article Views (full-text article views including HTML views, PDF and ePub downloads, according to the available data) and Abstracts Views on Vision4Press platform.
Data correspond to usage on the plateform after 2015. The current usage metrics is available 48-96 hours after online publication and is updated daily on week days.
Initial download of the metrics may take a while.