Fig. 1.
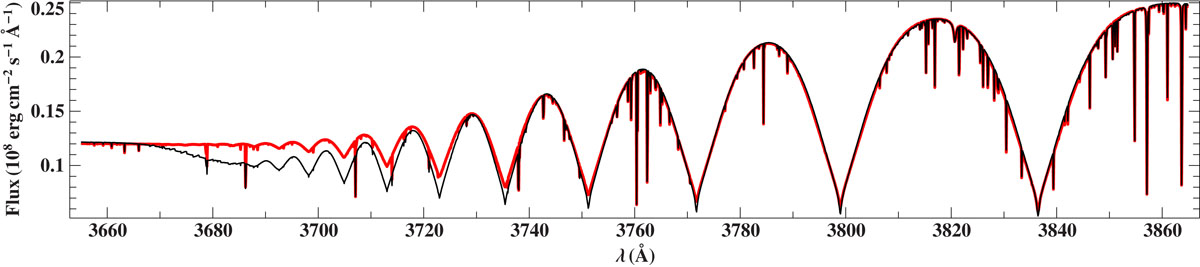
Comparison of synthetic spectra (Teff = 12 000 K, log(g) = 4.4, solar composition) calculated with the original Atlas12 code (thin black line) and our modified version including level dissolution (thick red line). The proper implementation of this effect allows us to exploit the region around the Balmer jump, which is an important indicator for the surface gravity, for quantitative spectral analysis, which is particularly important for the analysis of the MMT spectra given their spectral range (3600–4500 Å).
Current usage metrics show cumulative count of Article Views (full-text article views including HTML views, PDF and ePub downloads, according to the available data) and Abstracts Views on Vision4Press platform.
Data correspond to usage on the plateform after 2015. The current usage metrics is available 48-96 hours after online publication and is updated daily on week days.
Initial download of the metrics may take a while.