Fig. 3.
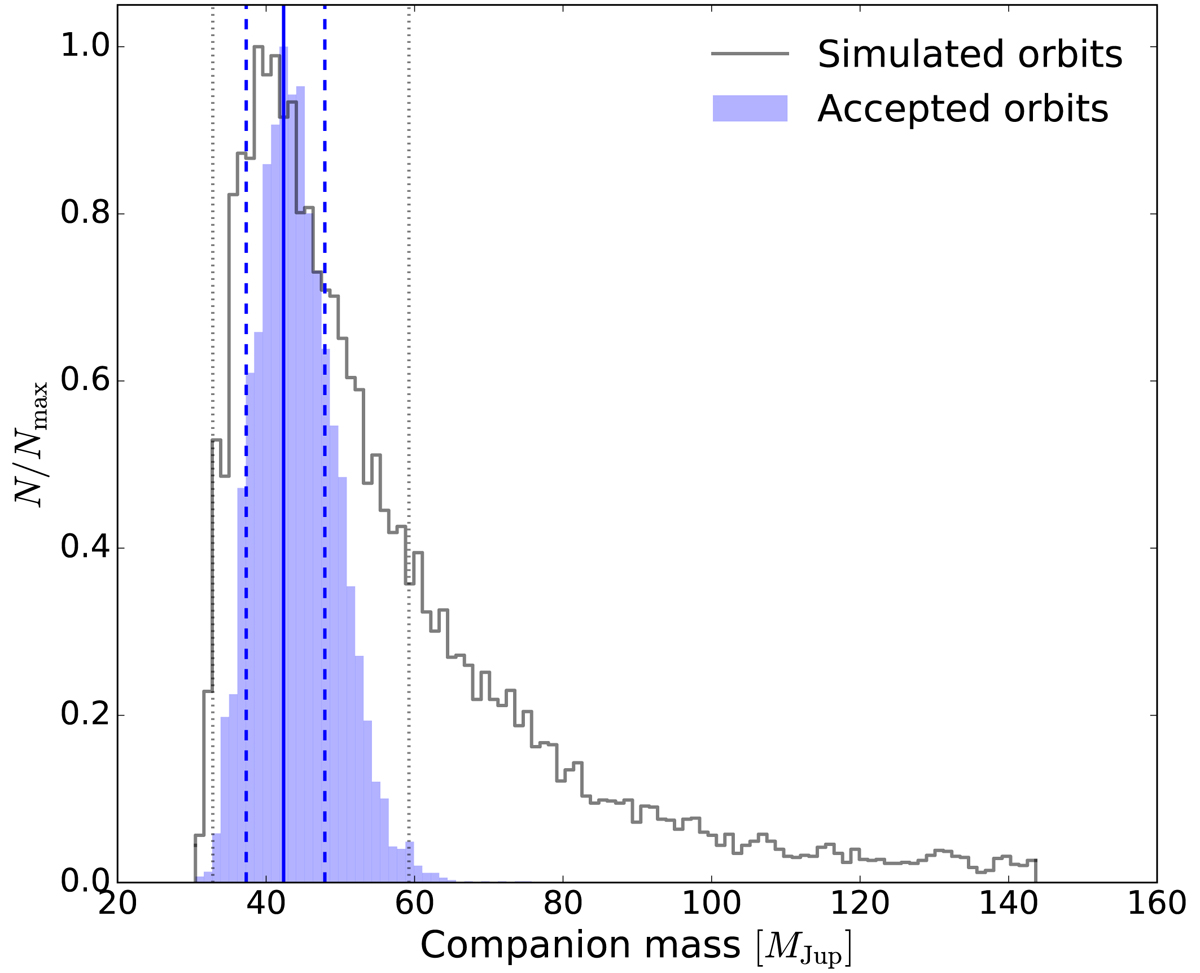
Companion mass distribution, where the solid black line shows the N = 20 000 simulated orbits that were best fitted to the relative astrometry from Bowler et al. (2018) and the blue-tinted area only includes the accepted orbits that coincide with the differential proper motion between HIPPARCOS and Gaia. The blue solid line depicts the median of the most populated bin in the accepted orbits histogram, and the dashed and dotted lines indicate the positions of the 1−σ uncertainty for the estimated companion mass for the accepted orbits and all orbits respectively, computed as the minimum range that encompasses 68.27% of the predicted mass-values.
Current usage metrics show cumulative count of Article Views (full-text article views including HTML views, PDF and ePub downloads, according to the available data) and Abstracts Views on Vision4Press platform.
Data correspond to usage on the plateform after 2015. The current usage metrics is available 48-96 hours after online publication and is updated daily on week days.
Initial download of the metrics may take a while.