Fig. 2.
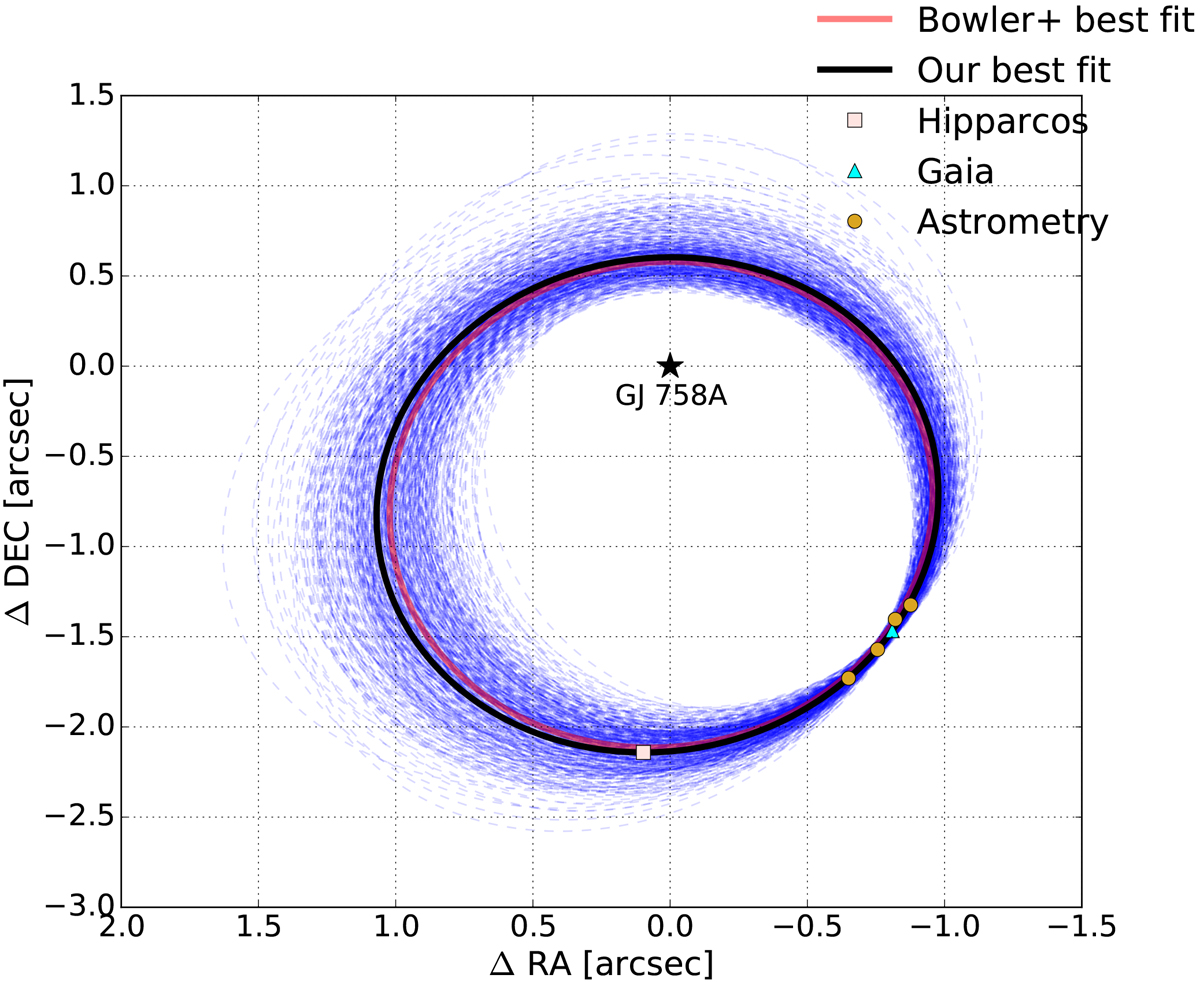
Fitted orbits of the predicted values that correspond to the measured Δμ, given by the blue dashed lines in the plot. The red line is the best-fit orbit from Bowler et al. (2018) and the black solid line shows the orbit for the best-fit orbit from the allowed Δμ values. The yellow circles show the relative astrometric measurement from the literature, ranging epochs from 2010.5 to 2017.8. The epochs at 1991.25 and 2015.50 depicted by the rose-tinted square and the cyan triangle represent the HIPPARCOS and Gaia epochs, respectively.
Current usage metrics show cumulative count of Article Views (full-text article views including HTML views, PDF and ePub downloads, according to the available data) and Abstracts Views on Vision4Press platform.
Data correspond to usage on the plateform after 2015. The current usage metrics is available 48-96 hours after online publication and is updated daily on week days.
Initial download of the metrics may take a while.