Fig. 8
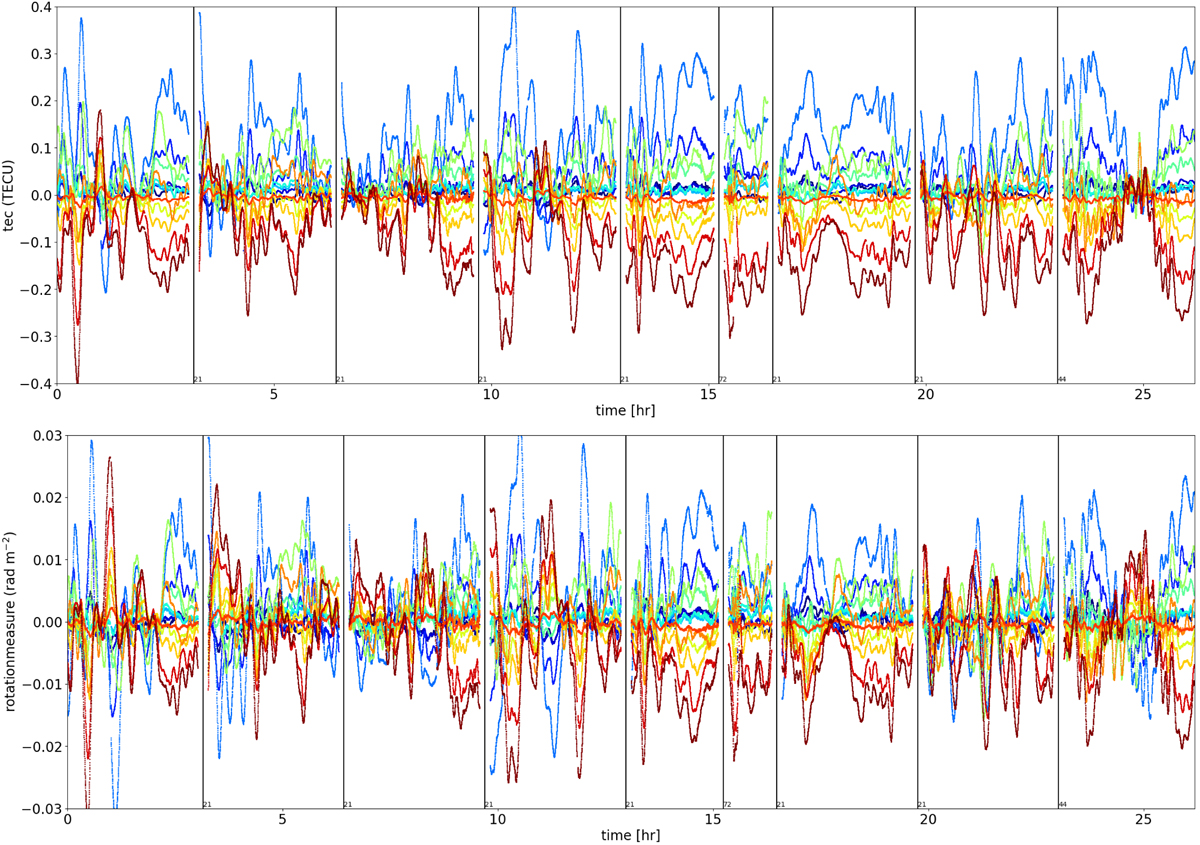
First-and second-order ionospheric effects quantified by variation of differential TEC and differential Faraday rotation between the LOFAR core and all remote stations. Each panel is a separate observation towards 3C380. The gaps between observations are: 21, 21, 21, 21, 72, 21, 21, and 44 hr. Stations are colour-coded in alphabetical order. The similarity between the top and bottom panels is due to the TEC dependency of Faraday rotation.
Current usage metrics show cumulative count of Article Views (full-text article views including HTML views, PDF and ePub downloads, according to the available data) and Abstracts Views on Vision4Press platform.
Data correspond to usage on the plateform after 2015. The current usage metrics is available 48-96 hours after online publication and is updated daily on week days.
Initial download of the metrics may take a while.