Free Access
Fig. 7
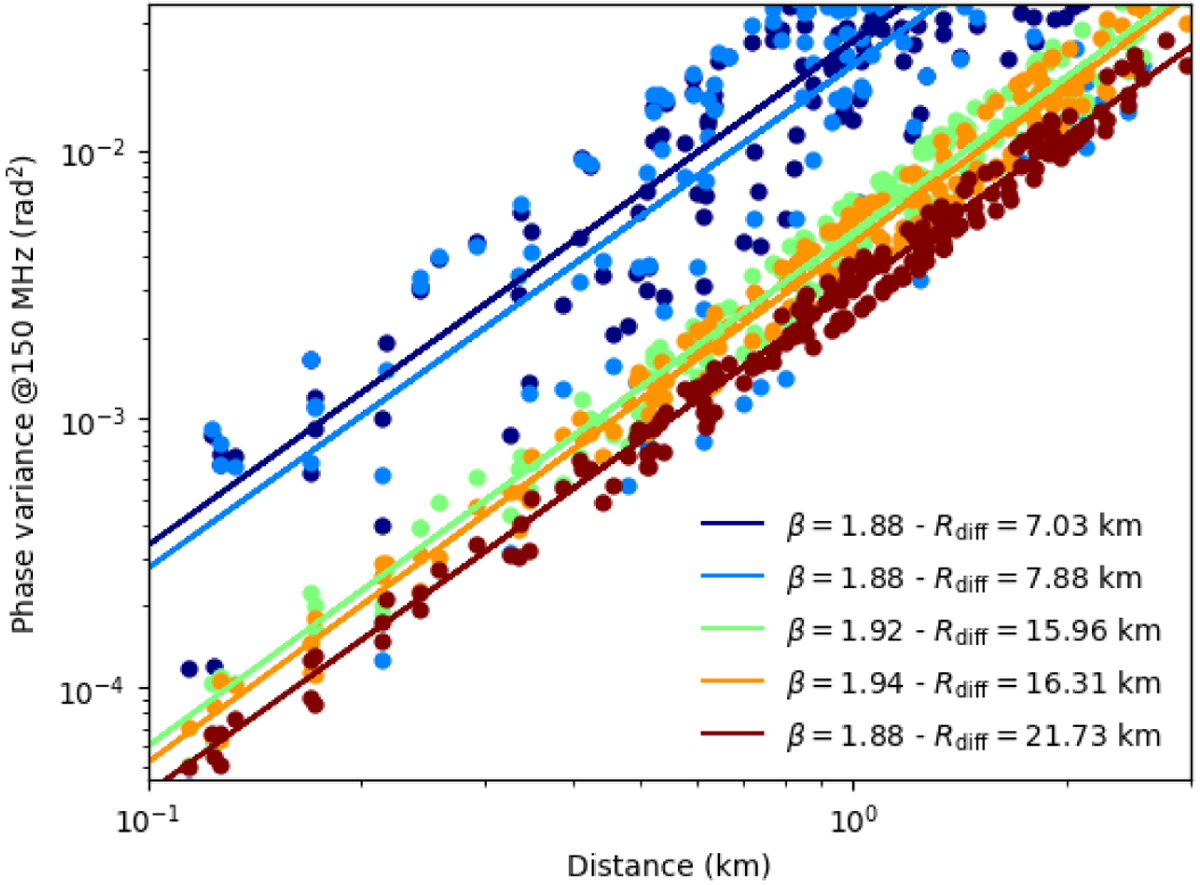
Phasestructure function divided into five time chunks for the observation of Fig. 3. The initial part of the observations is visibly more affected by ionospheric disturbances also in Fig. 3. The phase variance is converted to the expected value at 150 MHz to compare it with other experiments such as LOFAR HBA and MWA.
Current usage metrics show cumulative count of Article Views (full-text article views including HTML views, PDF and ePub downloads, according to the available data) and Abstracts Views on Vision4Press platform.
Data correspond to usage on the plateform after 2015. The current usage metrics is available 48-96 hours after online publication and is updated daily on week days.
Initial download of the metrics may take a while.