Fig. 6
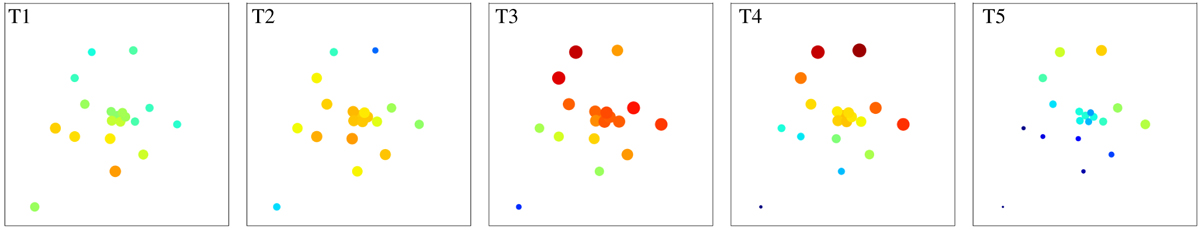
Left to right: time evolution of amplitude solutions for LOFAR core stations for the observation shown in Fig. 3. Each plot is separated from the next by 10 s. Each point represents a core station and each is positioned in the plot according to its geographical location. Colour (blue to red) and size (small to large) are related to the value of the amplitude correction (from − 10% to + 10%). A wave travelling south–north is visible. Similar structures were also reported with single-station observations. The full movie is available in the online material.
Current usage metrics show cumulative count of Article Views (full-text article views including HTML views, PDF and ePub downloads, according to the available data) and Abstracts Views on Vision4Press platform.
Data correspond to usage on the plateform after 2015. The current usage metrics is available 48-96 hours after online publication and is updated daily on week days.
Initial download of the metrics may take a while.