Fig. 4
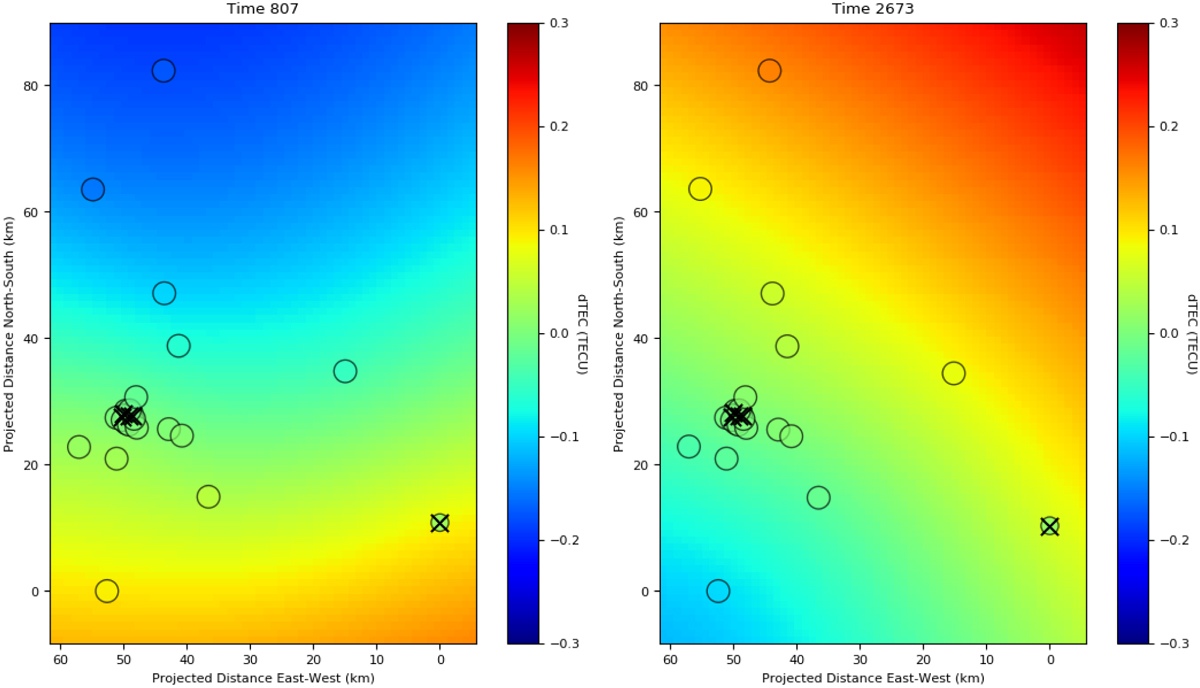
Two examples of TEC-screen fits from the observation shown in Fig. 3. Values are in differential TECU withrespect to station CS 002. Each circle represents a LOFAR station; colour coded within the circle is the dTEC value for that station (we note that the markers are filled with the colour corresponding to the measured dTEC). The background colour is the TEC screen fitted across the array as described in the text. Stations crossed with an X are the same excluded from Fig. 2. The full movie is available in the online material.
Current usage metrics show cumulative count of Article Views (full-text article views including HTML views, PDF and ePub downloads, according to the available data) and Abstracts Views on Vision4Press platform.
Data correspond to usage on the plateform after 2015. The current usage metrics is available 48-96 hours after online publication and is updated daily on week days.
Initial download of the metrics may take a while.