Fig. 3
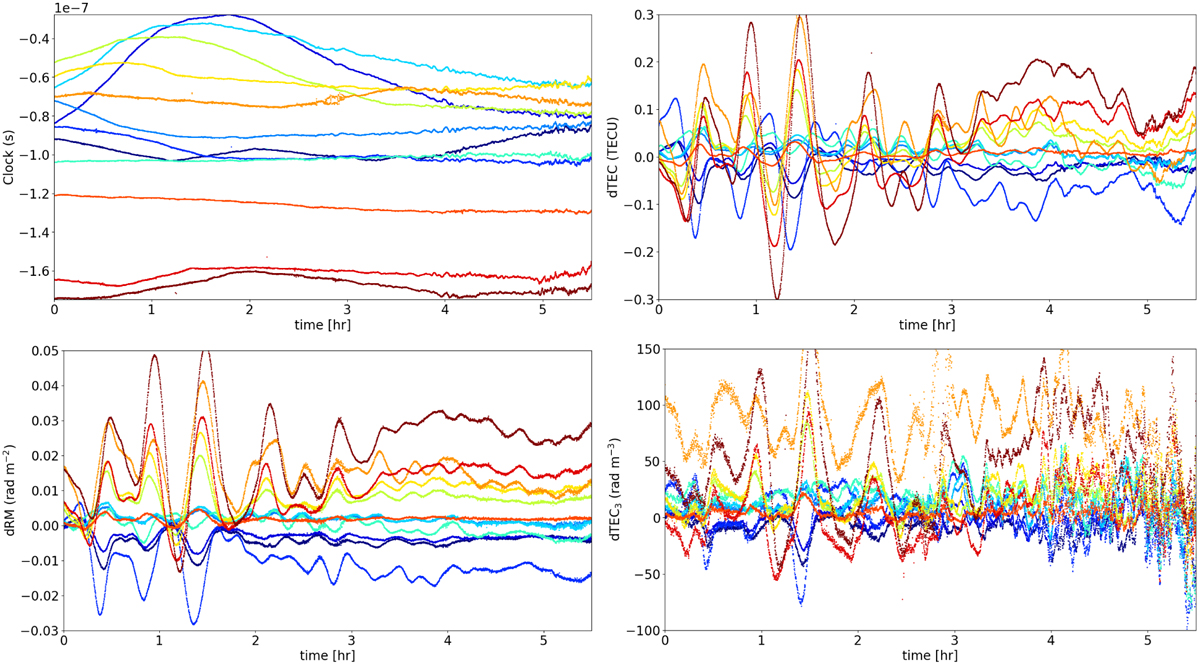
From top-left to bottom-right: instrumental clock delay (in s). Total electron content variation along the observation (in TECU). Faraday rotation (in rad m−2 ). Ionospheric third-order effect (in rad m−3). All values are differential between CS 001 (assumed constant at 0) and all remote stations (from blue to red in alphabeticalorder).
Current usage metrics show cumulative count of Article Views (full-text article views including HTML views, PDF and ePub downloads, according to the available data) and Abstracts Views on Vision4Press platform.
Data correspond to usage on the plateform after 2015. The current usage metrics is available 48-96 hours after online publication and is updated daily on week days.
Initial download of the metrics may take a while.