Fig. 1.
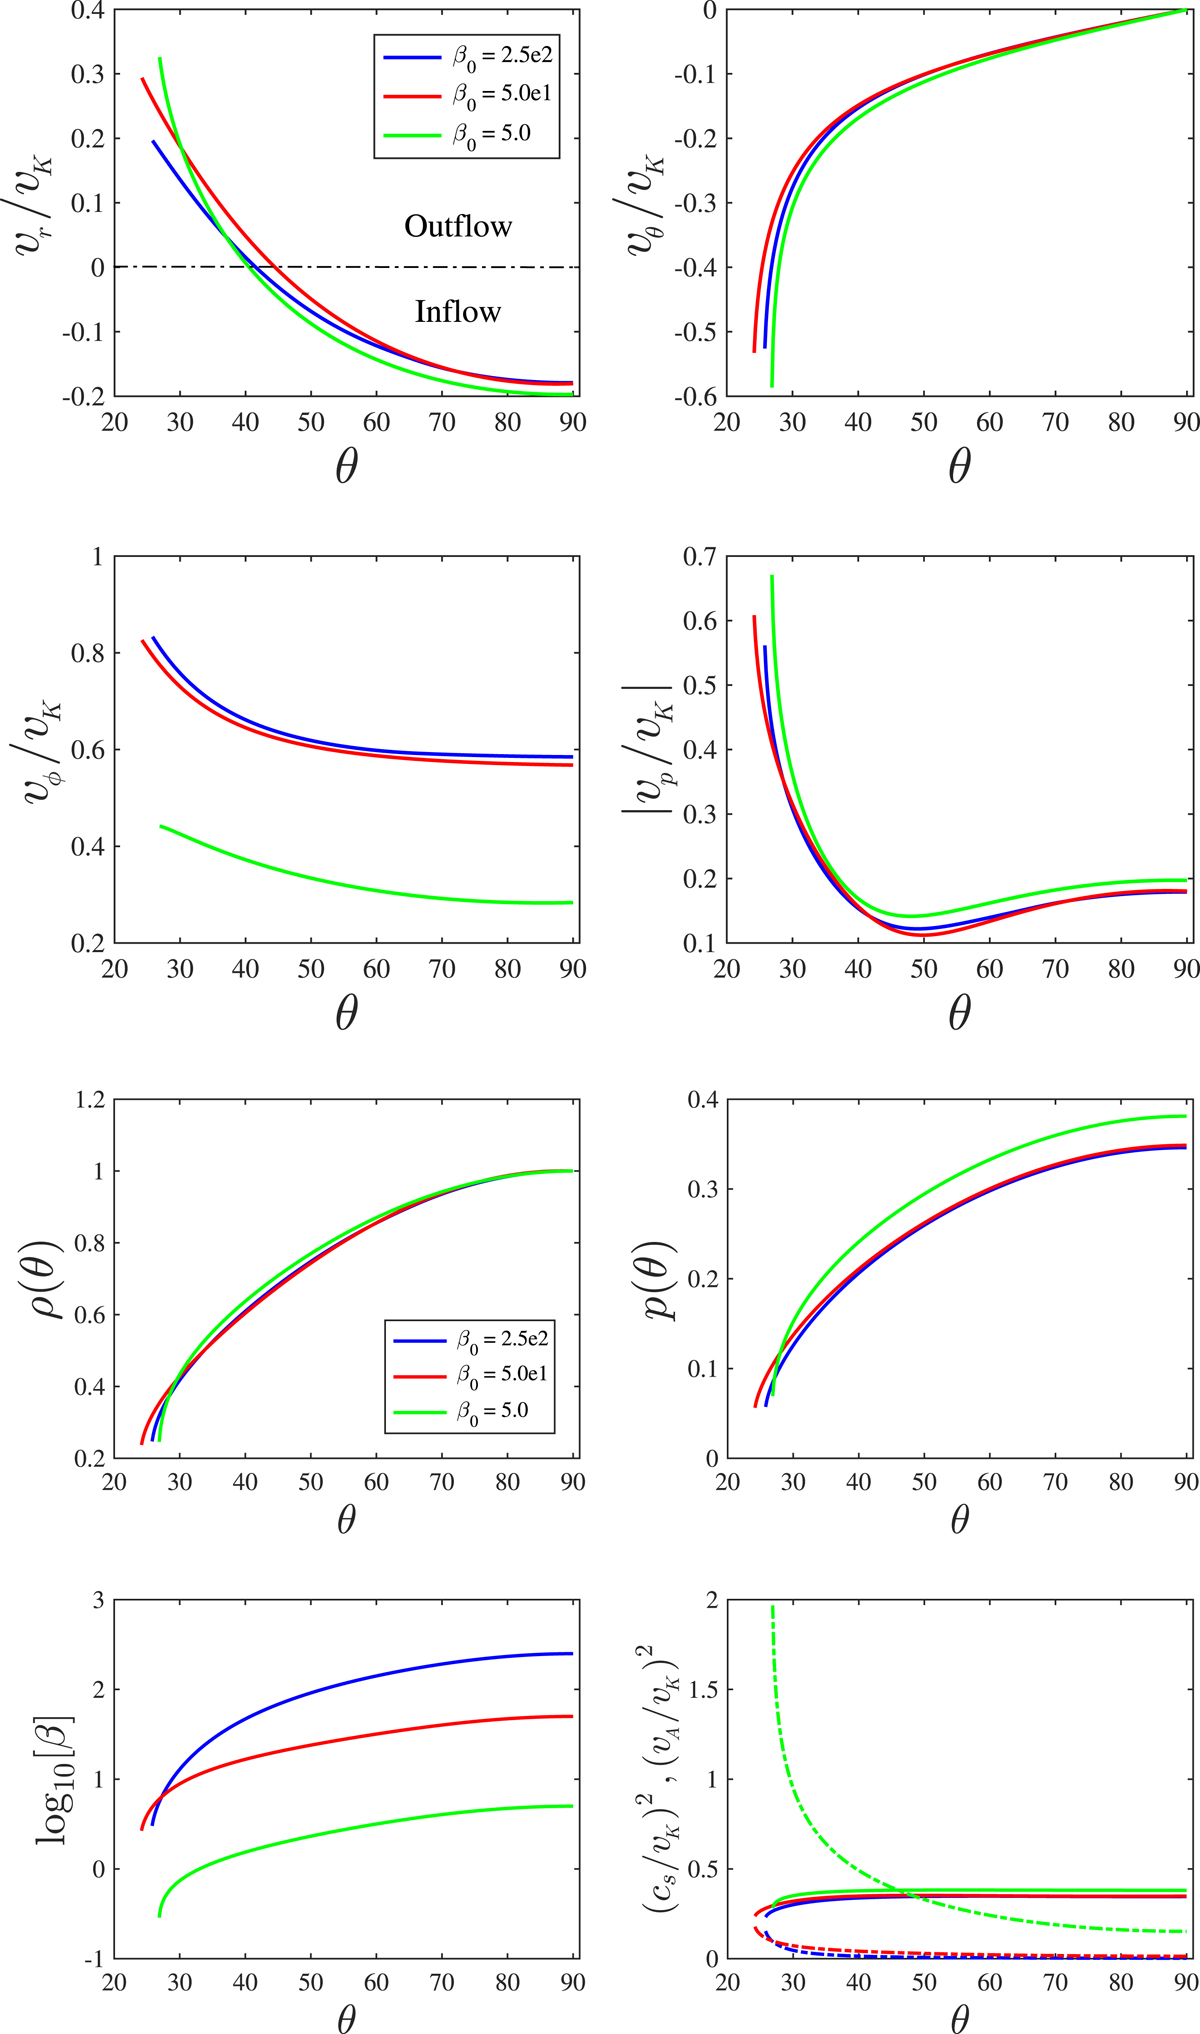
Angular profiles of variables. The blue, red, and green lines are for β0 = 250, 50, and 5, respectively. The ratio of gas pressure to magnetic pressure at the equatorial plane is denoted by β0. Top-left panel: radial velocity. Top-right panel: vθ. Left panel of the second row: azimuthal velocity. Right panel of the second row: poloidal velocity (![]() ). Left panel of the third row: density. Right panel of the third row: gas pressure. Bottom-left panel: β. In the bottom-right panel, the solid lines are for sound speed and the dashed lines are for Alfven speed. The top-left panel shows that the radial velocity changes its sign at θ ~ 40°.
). Left panel of the third row: density. Right panel of the third row: gas pressure. Bottom-left panel: β. In the bottom-right panel, the solid lines are for sound speed and the dashed lines are for Alfven speed. The top-left panel shows that the radial velocity changes its sign at θ ~ 40°.
Current usage metrics show cumulative count of Article Views (full-text article views including HTML views, PDF and ePub downloads, according to the available data) and Abstracts Views on Vision4Press platform.
Data correspond to usage on the plateform after 2015. The current usage metrics is available 48-96 hours after online publication and is updated daily on week days.
Initial download of the metrics may take a while.