Free Access
Fig. 3.
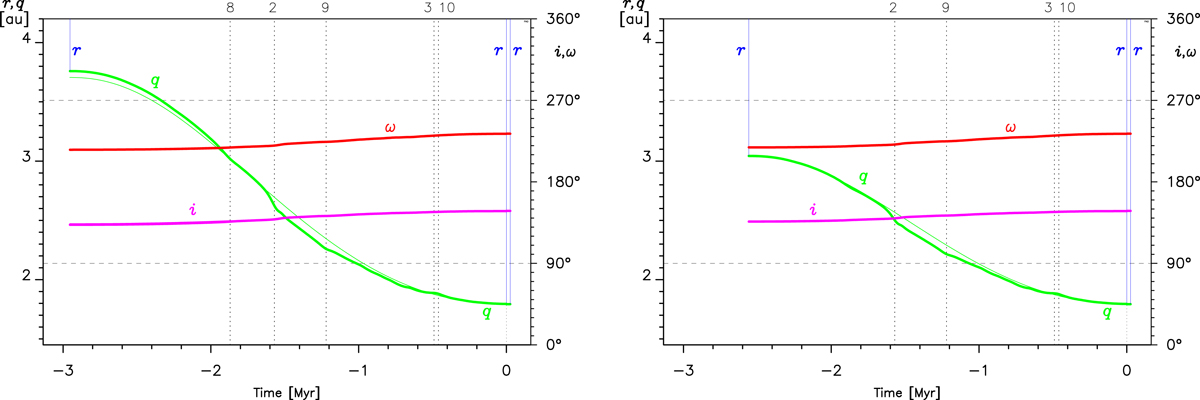
Past and future dynamics of K2 for solutions A1 (left panel) and A0 (right panel). In both panels the horizontal time axis extends from the previous perihelion through the observed one to the subsequent perihelion passage. See text for a detailed explanation.
Current usage metrics show cumulative count of Article Views (full-text article views including HTML views, PDF and ePub downloads, according to the available data) and Abstracts Views on Vision4Press platform.
Data correspond to usage on the plateform after 2015. The current usage metrics is available 48-96 hours after online publication and is updated daily on week days.
Initial download of the metrics may take a while.