Fig. 1.
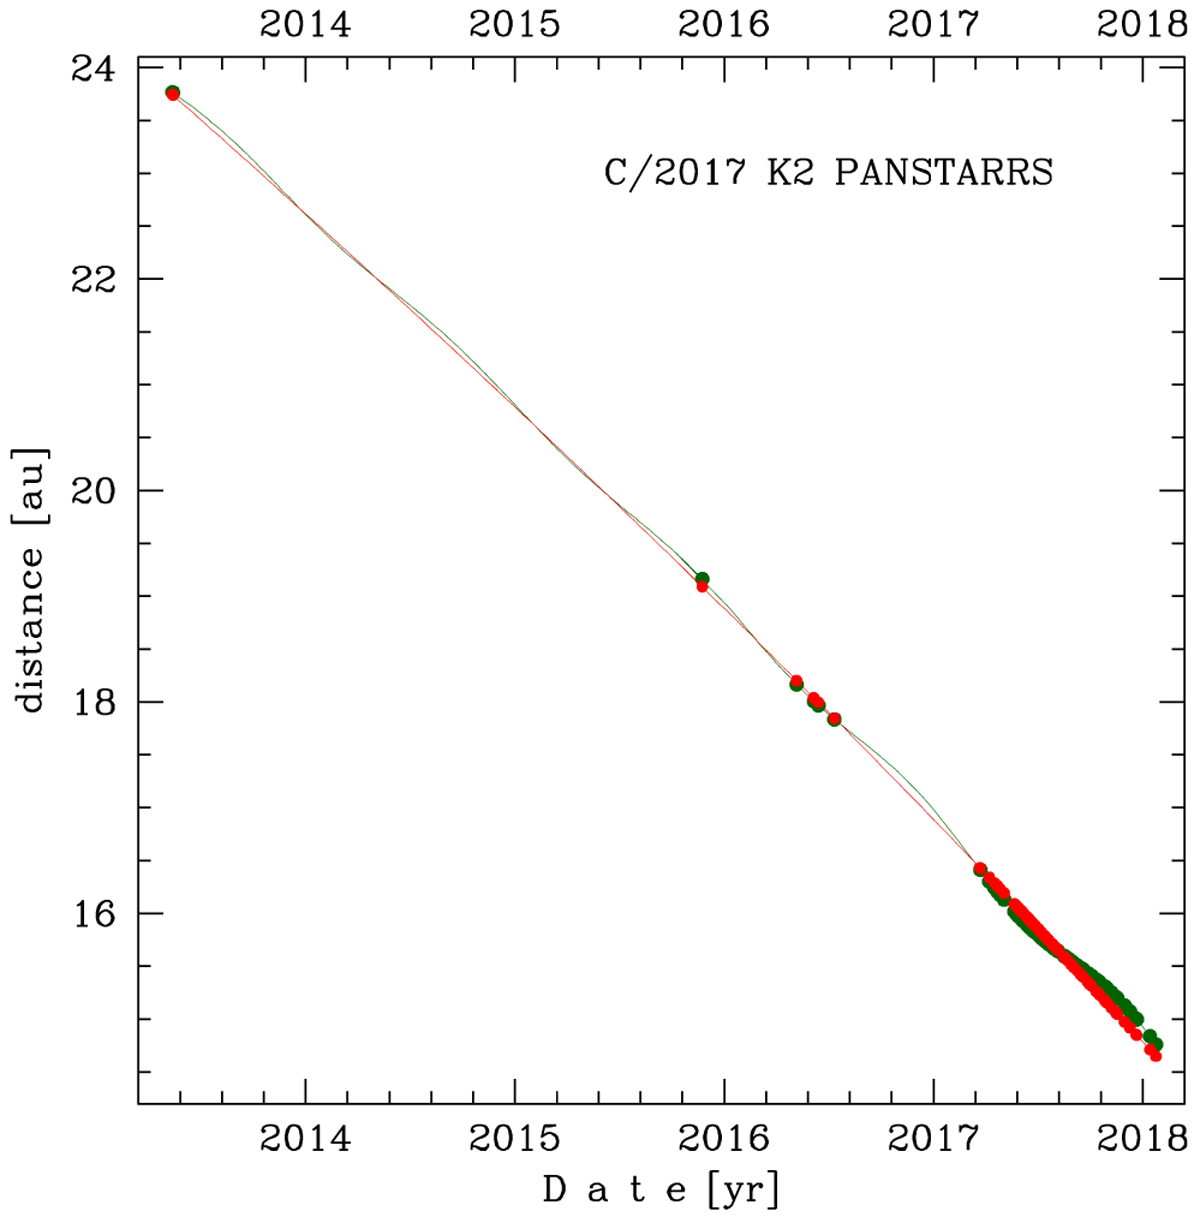
Heliocentric (thin red curve) and geocentric (green curve) distance of K2 during the time interval given in Table 1. The time distribution of positional observations of K2 with corresponding heliocentric distance at which they were taken is shown with red dots. The geocentric distances of measurements are shown with green dots but they are almost covered by red dots because of similarly large distances from the Sun and the Earth.
Current usage metrics show cumulative count of Article Views (full-text article views including HTML views, PDF and ePub downloads, according to the available data) and Abstracts Views on Vision4Press platform.
Data correspond to usage on the plateform after 2015. The current usage metrics is available 48-96 hours after online publication and is updated daily on week days.
Initial download of the metrics may take a while.