Fig. 8.
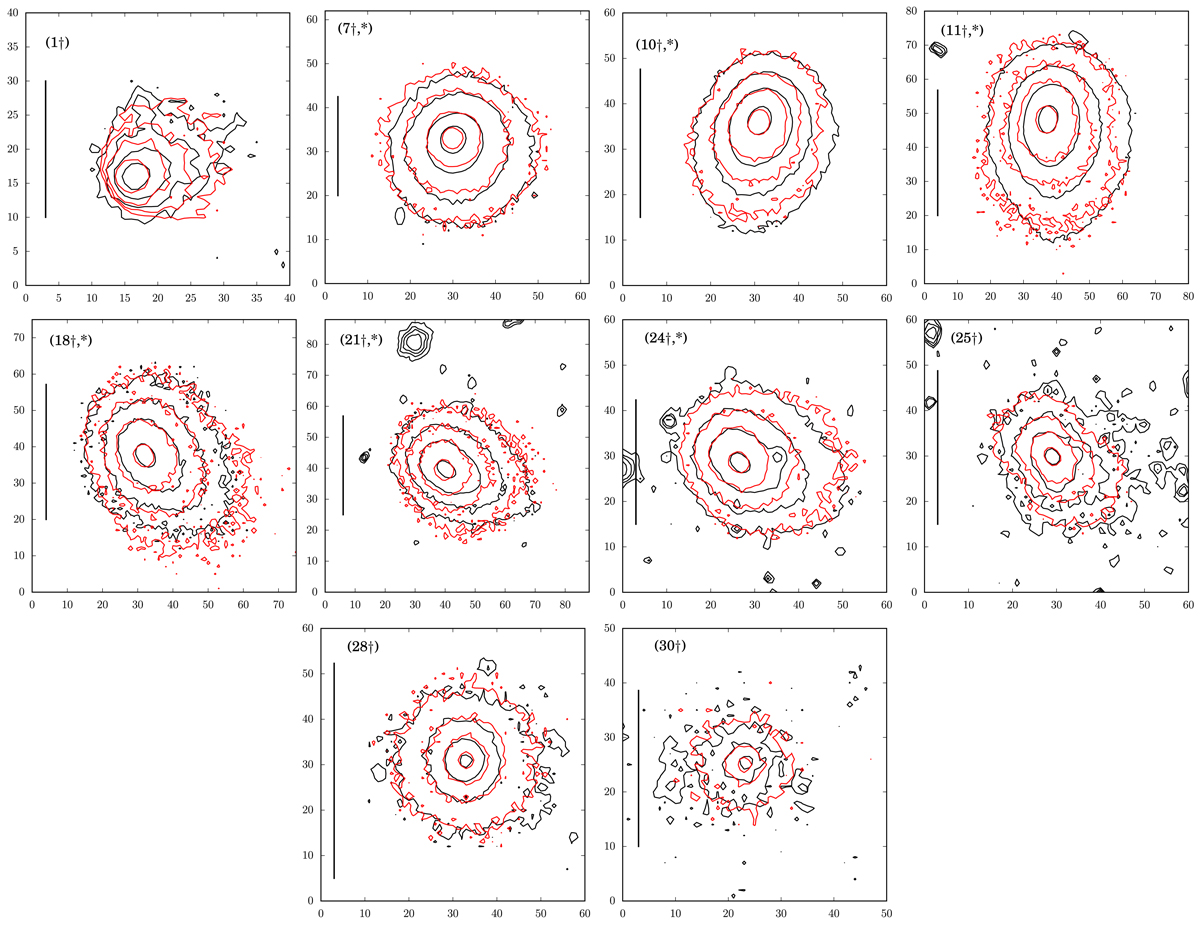
Comparison of a subset of ten observed and modelled images. The selected observed images are marked with a † in Fig. 1; here we keep the same numeration. For modelling purposes, those images labelled with an “*” were rebinned ×2 with respect to the values given in Table 1. The isophote levels in SDU in each case are: (1†) 0.5 × 10⁻¹⁴, 1.0 × 10⁻¹⁴, 2.0 × 10⁻¹⁴ and 6.0 × 10⁻¹⁴. (7†,*) 1.7 × 10⁻¹⁴, 3.0 × 10⁻¹⁴, 7.0 × 10⁻¹⁴ and 2.0 × 10⁻¹³. (10†,*) 4.0 × 10⁻¹⁴, 7.0 × 10⁻¹⁴, 1.2 × 10⁻¹³ and 4.0 × 10⁻¹³. (11†,*) 4.0 × 10⁻¹⁴, 7.0 × 10⁻¹⁴, 1.2 × 10⁻¹⁴ and 4.0 × 10⁻¹³. (18†,*) 4.0 × 10⁻¹⁴, 7.0 × 10⁻¹⁴, 1.2 × 10⁻¹⁴ and 4.0 × 10⁻¹³. (21†,*) 4.0 × 10⁻¹⁴, 7.0 × 10⁻¹⁴, 1.2 × 10⁻¹⁴ and 4.0 × 10⁻¹³. (24†,*) 4.0 × 10⁻¹⁴, 7.0 × 10⁻¹⁴, 1.2 × 10⁻¹⁴ and 4.0 × 10⁻¹³. (25†) 4.0 × 10⁻¹⁴, 7.0 × 10⁻¹⁴, 1.2 × 10⁻¹⁴ and 4.0 × 10⁻¹³. (30†) 1.7 × 10⁻¹⁴, 3.5 × 10⁻¹⁴ and 9.0 × 10⁻¹⁴. In all cases, the black contours correspond to observations and the red ones to the model. The black vertical lines correspond to 2 × 10⁴ km in the sky plane, and the y and x axes are given in pixels.
Current usage metrics show cumulative count of Article Views (full-text article views including HTML views, PDF and ePub downloads, according to the available data) and Abstracts Views on Vision4Press platform.
Data correspond to usage on the plateform after 2015. The current usage metrics is available 48-96 hours after online publication and is updated daily on week days.
Initial download of the metrics may take a while.