Fig. 2.
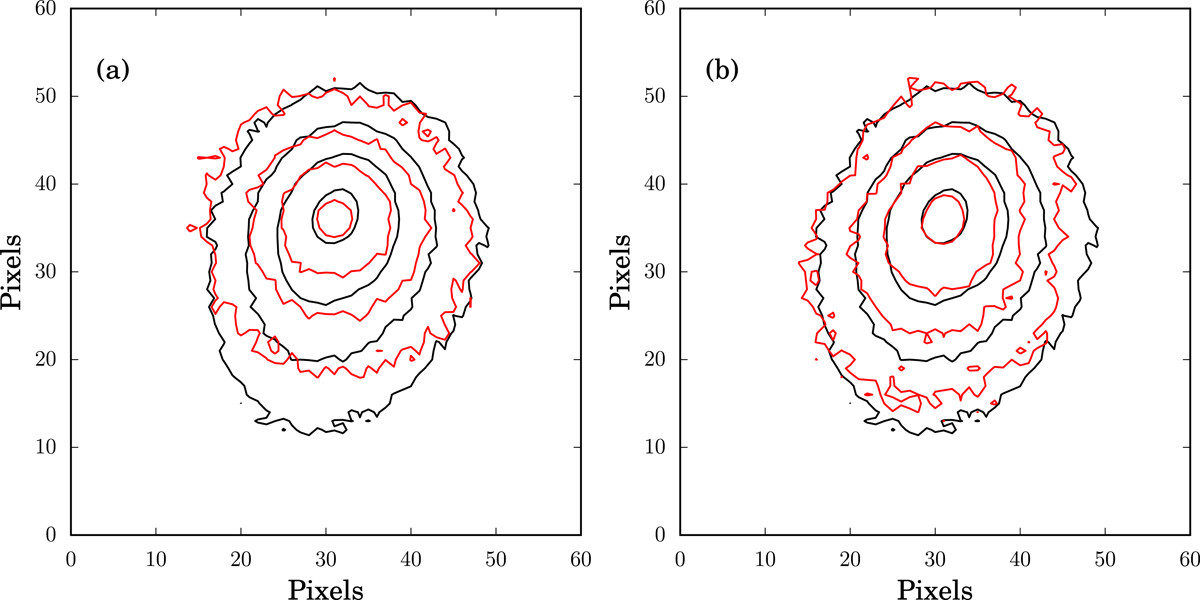
Comparison between the full isotropic model (panel a), and the hybrid model (panel b). In both cases, the red contours correspond to the models and the black ones to the observations. The observation date is March 14, 2017. For modelling purposes, the image was rebinned ×2 with respect to the value given in Table 1. Therefore, the resolution is 612.6 km pixel−1. In all cases the isophote levels are: 4 × 10⁻¹⁴, 7 × 10⁻¹⁴, 1.25 × 10⁻¹³ and 4 × 10⁻¹³ SDU. The validity of the models, determined via the χ parameter, confirms that the isotropic model offers a poorer fit (χisotropic = 3.9) than the hybrid model (χhybrid = 2.4). The plot is orientated so that north is up and east is to the left.
Current usage metrics show cumulative count of Article Views (full-text article views including HTML views, PDF and ePub downloads, according to the available data) and Abstracts Views on Vision4Press platform.
Data correspond to usage on the plateform after 2015. The current usage metrics is available 48-96 hours after online publication and is updated daily on week days.
Initial download of the metrics may take a while.