Fig. 13.
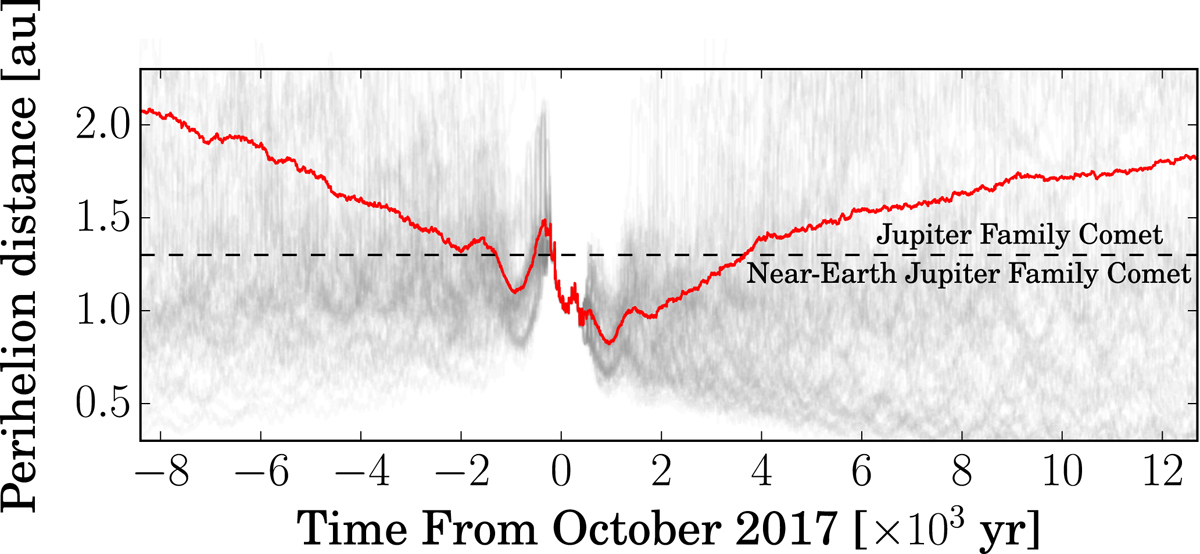
Perihelion evolution during the time in which comet 41P is in the JFC region with a 90% of CL. Grey orbits correspond with the whole set of clones, which take into account both the pure gravitational model and the model that includes non-gravitational forces. The red line is the average perihelion q̄. The dashed horizontal line differentiates between the JFC and NEJFC regions.
Current usage metrics show cumulative count of Article Views (full-text article views including HTML views, PDF and ePub downloads, according to the available data) and Abstracts Views on Vision4Press platform.
Data correspond to usage on the plateform after 2015. The current usage metrics is available 48-96 hours after online publication and is updated daily on week days.
Initial download of the metrics may take a while.