Fig. 12.
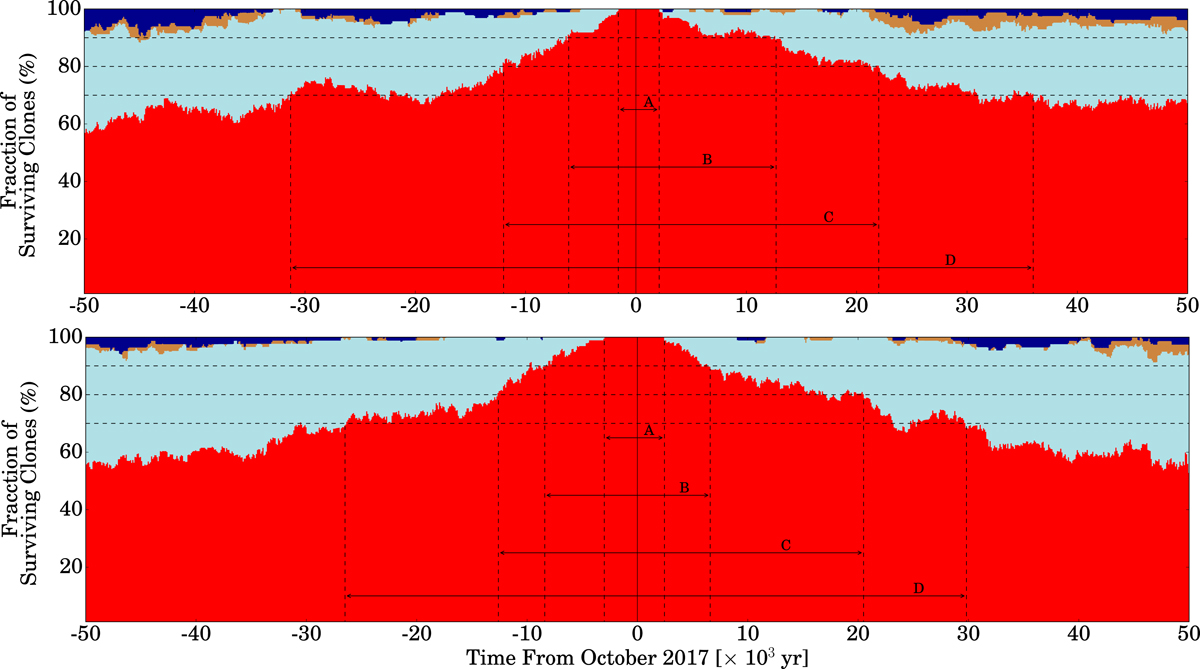
Statistical orbital evolution of comet 41P and its 200 clones over 105 yr: 5 × 10⁴ backward in time and 5 × 10⁴ forward. The top panel corresponds to a pure gravitational model, while in the bottom panel non-gravitational forces are included. In both panels different colours refer to different regions in the solar system, namely: red for those in the Jupiter family region, clear blue are Centaurs, yellow are Halley types, and dark blue are trans-Neptunians. Labels A, B, C, and D mean the time spent in the Jupiter family region at different confidence levels, i.e., % of clones in that region. Therefore, A is 100%, B is 90%, C is 80%, and D is 70%.
Current usage metrics show cumulative count of Article Views (full-text article views including HTML views, PDF and ePub downloads, according to the available data) and Abstracts Views on Vision4Press platform.
Data correspond to usage on the plateform after 2015. The current usage metrics is available 48-96 hours after online publication and is updated daily on week days.
Initial download of the metrics may take a while.