Fig. 9
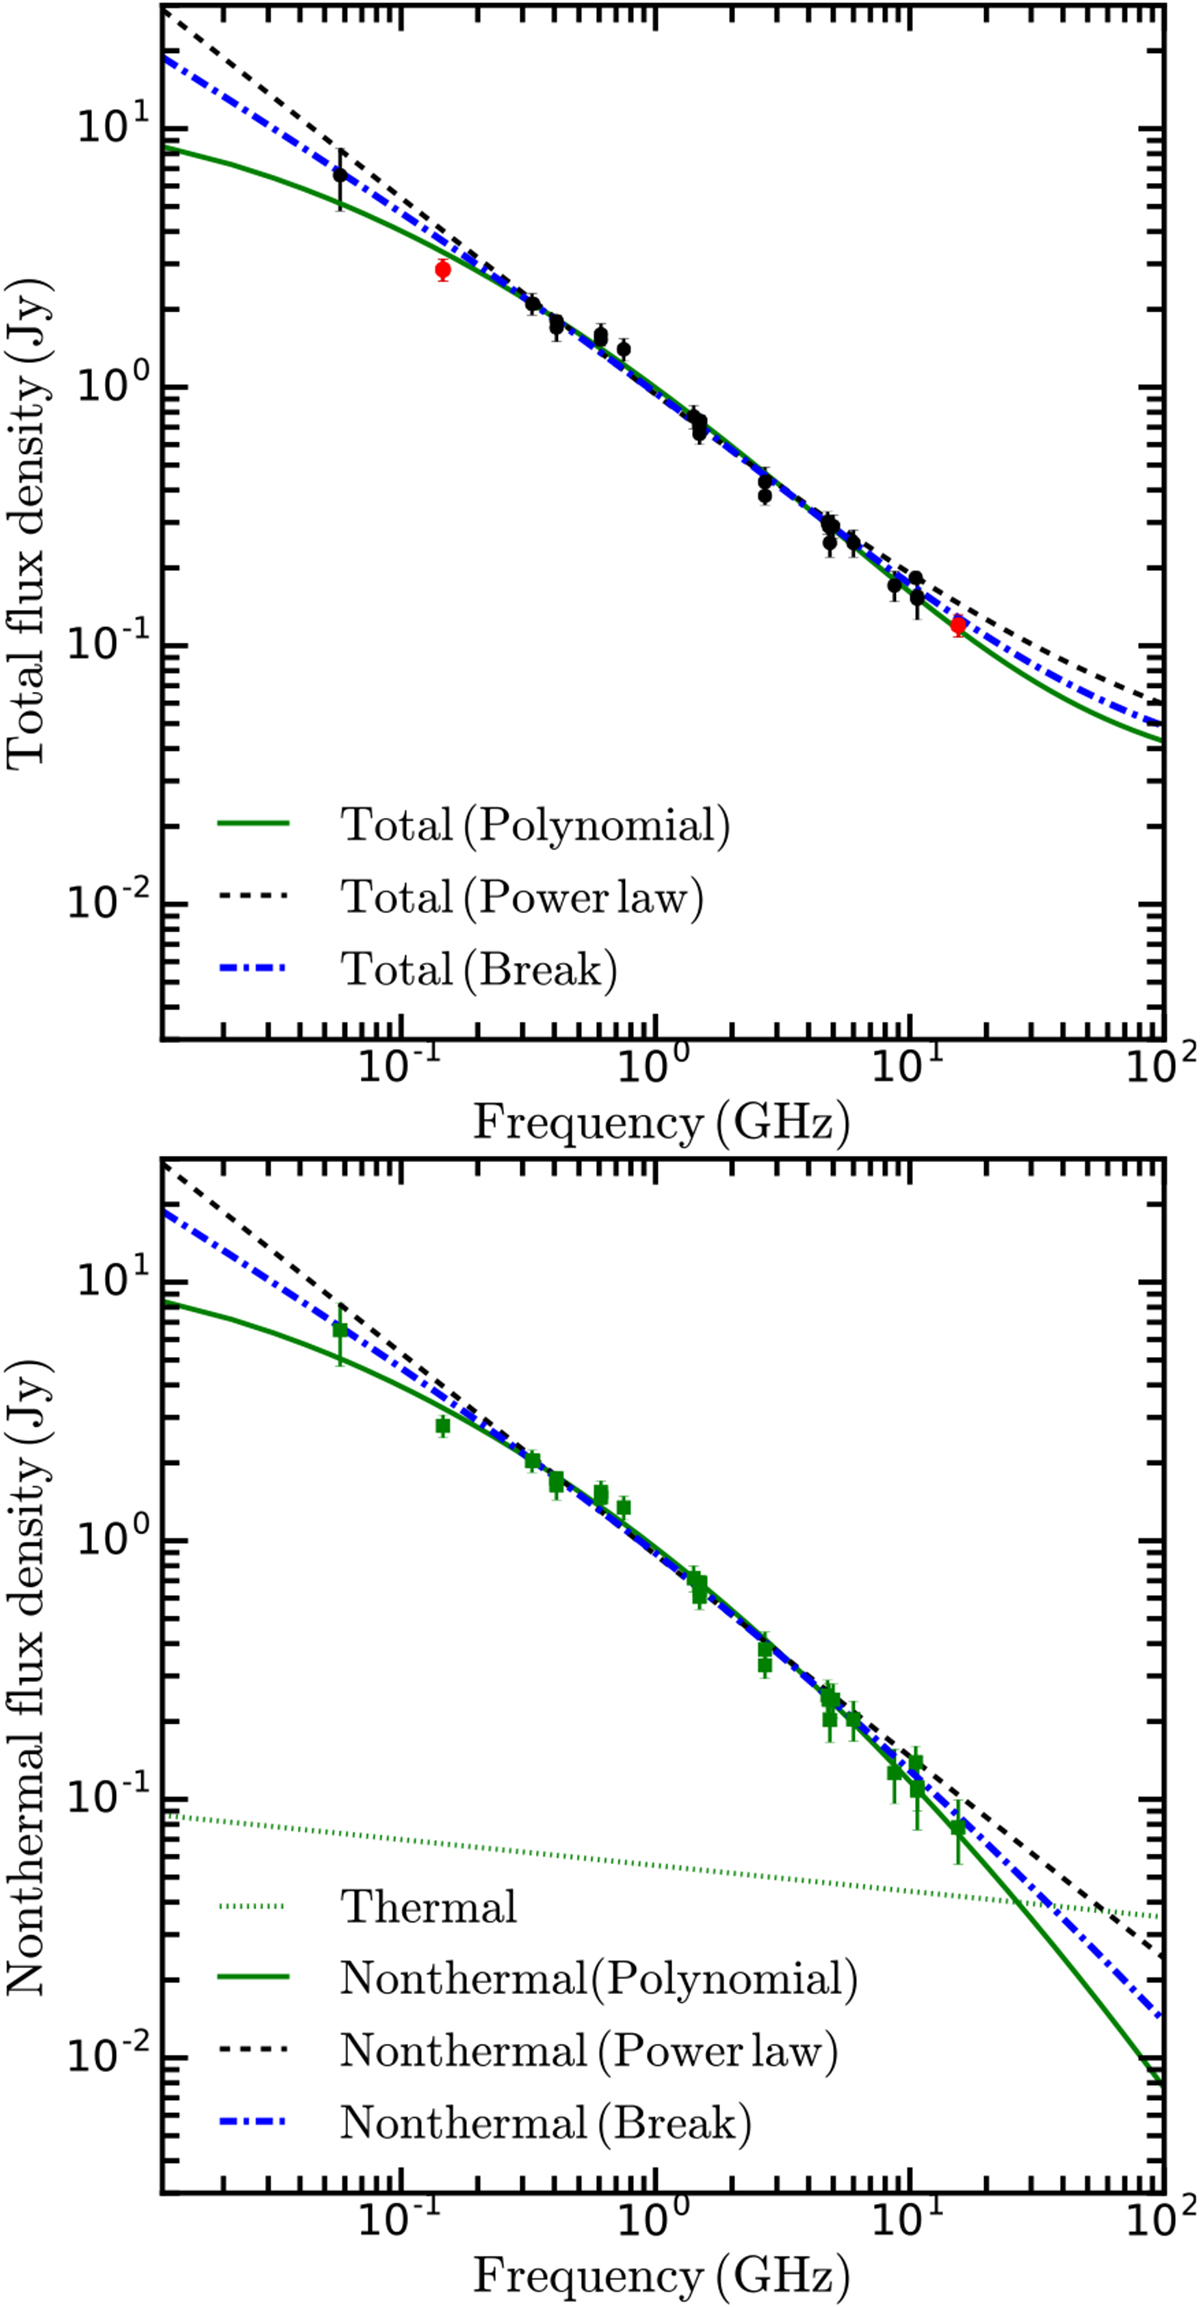
Top: integrated total flux densities of NGC 891 as listed in Table 5. The two new total flux densities from this paper are marked in red. Bottom: integrated nonthermal flux densities of NGC 891 after subtracting an estimate of the optically thin thermal free–free emission (shown as the green dotted line) from the total flux densities. The black dashed, solid green, and blue dashed–dotted lines in the bottom panel show the best-fit power law, second-order polynomial model, and spectral break model to the nonthermal emission, respectively. The corresponding lines in the top panel show the expected total flux density spectrum after adding the thermal free–free emission to the different models of the nonthermal spectrum.
Current usage metrics show cumulative count of Article Views (full-text article views including HTML views, PDF and ePub downloads, according to the available data) and Abstracts Views on Vision4Press platform.
Data correspond to usage on the plateform after 2015. The current usage metrics is available 48-96 hours after online publication and is updated daily on week days.
Initial download of the metrics may take a while.