Fig. 5
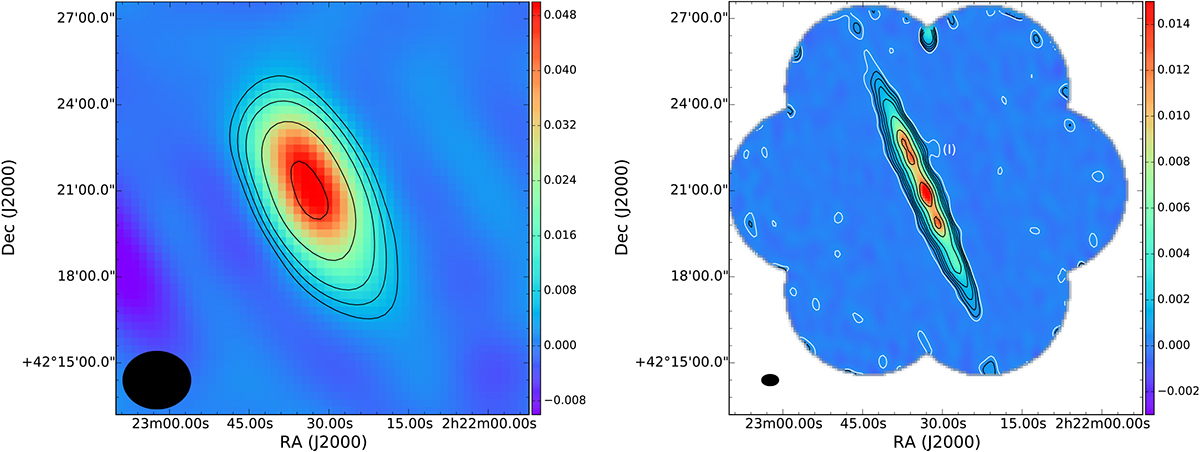
AMI maps of NGC 891 observed at a central frequency of 15.5 GHz with the Small Array (SA) at 142′′ × 121′′ resolution (left) and the Large Array (LA) at 36′′ × 24′′ resolution (right). For the SA image, contours are at 3, 5, 8, 16, 32, 64 × σ where σ = 1.5 mJy beam−1 is the rms noise level. For the LA image, contours are at 3 (white), 5, 8, 12, 18, 36, 72, 108 × σ where σ = 0.11 mJy beam−1 is the rms noise level. The colour scales are in units of Jy/beam. The sizes of the synthesized beams are shown by the filled ellipses in the bottom left corners.
Current usage metrics show cumulative count of Article Views (full-text article views including HTML views, PDF and ePub downloads, according to the available data) and Abstracts Views on Vision4Press platform.
Data correspond to usage on the plateform after 2015. The current usage metrics is available 48-96 hours after online publication and is updated daily on week days.
Initial download of the metrics may take a while.