Fig. 3
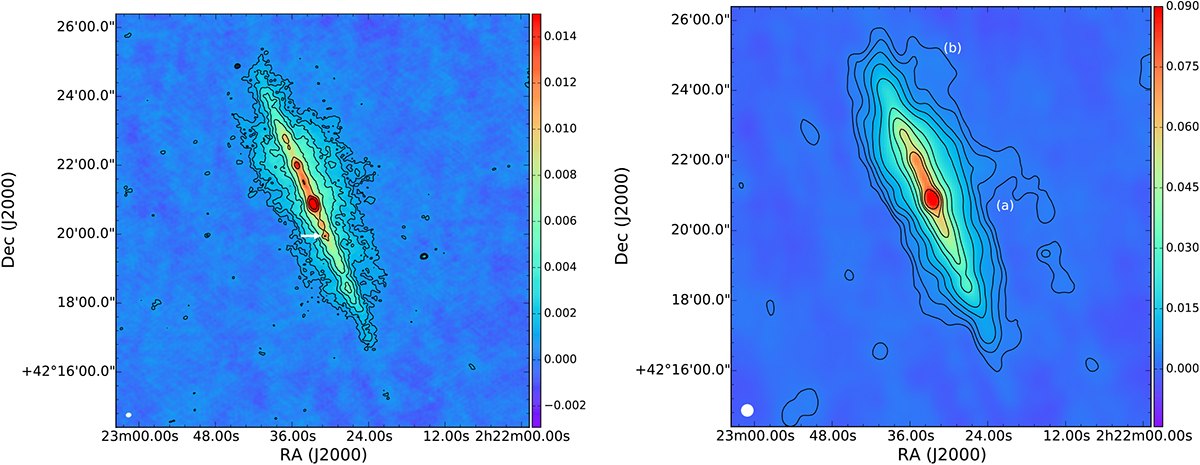
LOFAR maps of NGC 891 observed at a central frequency of 146.4 MHz with a bandwidth of 34.4 MHz at two different resolutions. Left panel: Resolution of 8.3′′ × 6.5′′ (shown by the filled ellipse in the bottom left corner). Contours are at 3, 5, 8, 12, 18, 32, 44, 64 × σ where σ = 0.29 mJy beam−1 is the rmsnoise level. The location of SN1986J is shown by the white arrow. Right panel: Resolution of 20′′ × 20′′ (shown bythe filled ellipse in the bottom left corner). Contours are at 3, 5, 8, 12, 18, 32, 44, 64, 76 × σ where σ = 0.8 mJy beam−1 is the rms noise level. The features denoted by “(a)” and “(b)” are discussed in Sect. 4. The colour scale is in units of Jy/beam.
Current usage metrics show cumulative count of Article Views (full-text article views including HTML views, PDF and ePub downloads, according to the available data) and Abstracts Views on Vision4Press platform.
Data correspond to usage on the plateform after 2015. The current usage metrics is available 48-96 hours after online publication and is updated daily on week days.
Initial download of the metrics may take a while.