Free Access
Fig. 11
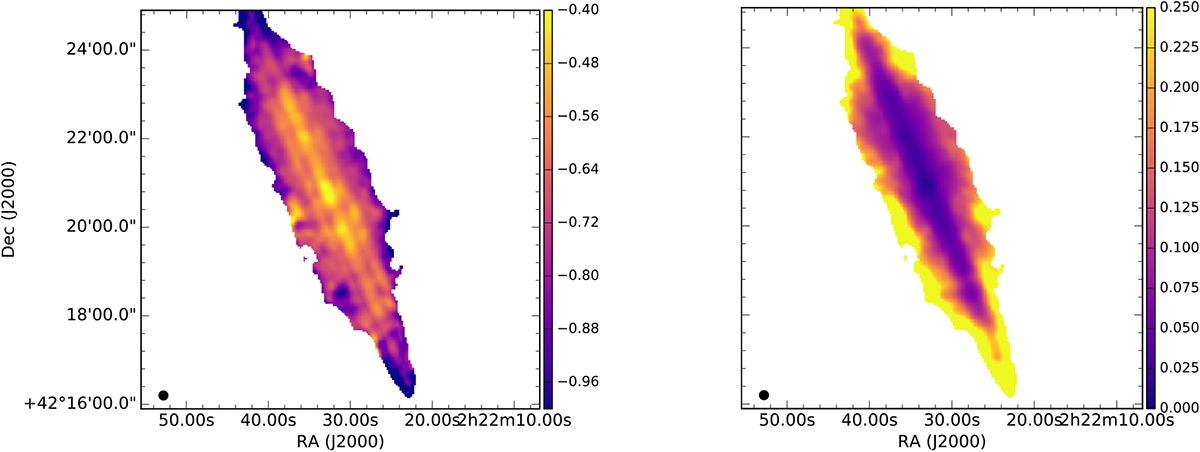
Maps of nonthermal spectral index (left panel) and corresponding error map (right panel) between 146 MHz and 1.5 GHz at 12′′ resolution. The beam is shown in the bottom left corner.
Current usage metrics show cumulative count of Article Views (full-text article views including HTML views, PDF and ePub downloads, according to the available data) and Abstracts Views on Vision4Press platform.
Data correspond to usage on the plateform after 2015. The current usage metrics is available 48-96 hours after online publication and is updated daily on week days.
Initial download of the metrics may take a while.