Fig. 9
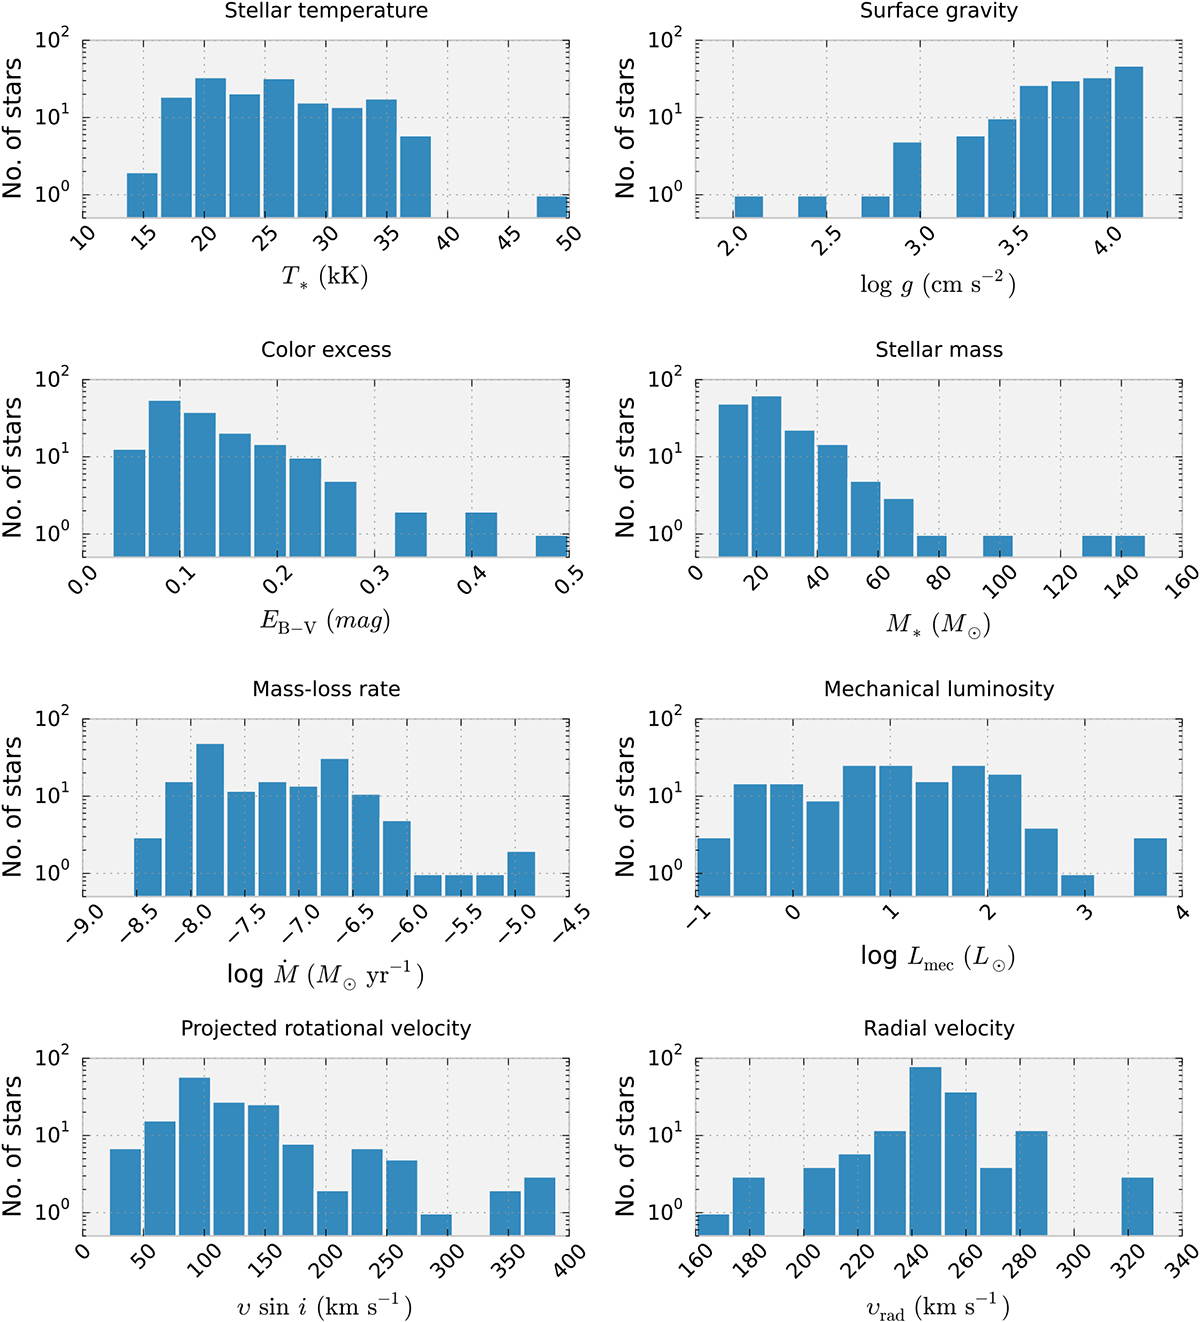
Histograms of stellar temperature, surface gravity, color excess, projected rotational velocity, radial velocity, stellar mass, mass-loss rate, and mechanical luminosity of OB stars in N 206 superbubble. The number of stars in the y-axis are shown in logarithmic scale. We used the square root (of data size) estimator method to calculate the optimal bin width and consequently the number of bins.
Current usage metrics show cumulative count of Article Views (full-text article views including HTML views, PDF and ePub downloads, according to the available data) and Abstracts Views on Vision4Press platform.
Data correspond to usage on the plateform after 2015. The current usage metrics is available 48-96 hours after online publication and is updated daily on week days.
Initial download of the metrics may take a while.