Fig. 8
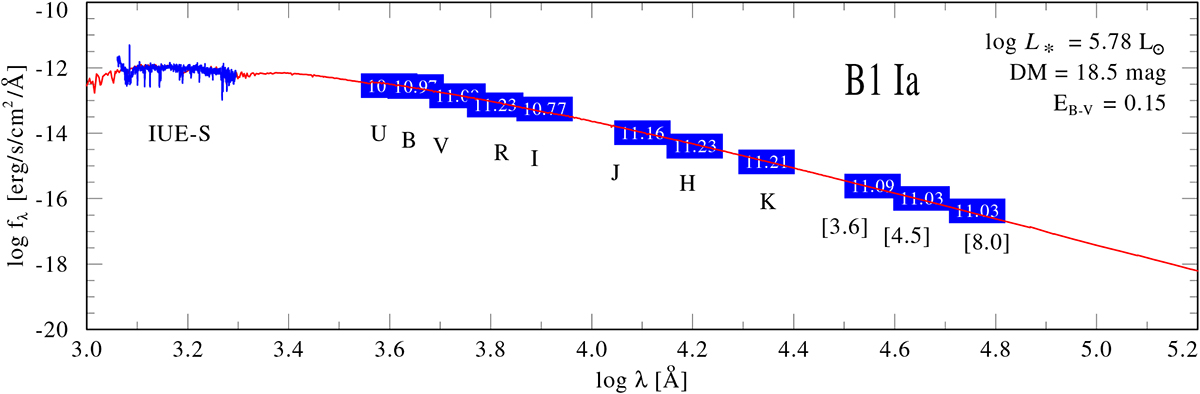
Spectral energy distribution fit of a sample B star (N206-FS 147). The model SED (red) is fitted to the available photometry from optical (UBV RI), near-infrared (JHKs), and mid-infrared (IRAC 3.6, 4.5, and 8.0 μm) bands (blue boxes) as well as the flux calibrated UV spectra from the HST. The luminosity L and the color excess EB−V of the best-fitting model are given in the figure.
Current usage metrics show cumulative count of Article Views (full-text article views including HTML views, PDF and ePub downloads, according to the available data) and Abstracts Views on Vision4Press platform.
Data correspond to usage on the plateform after 2015. The current usage metrics is available 48-96 hours after online publication and is updated daily on week days.
Initial download of the metrics may take a while.