Fig. 28
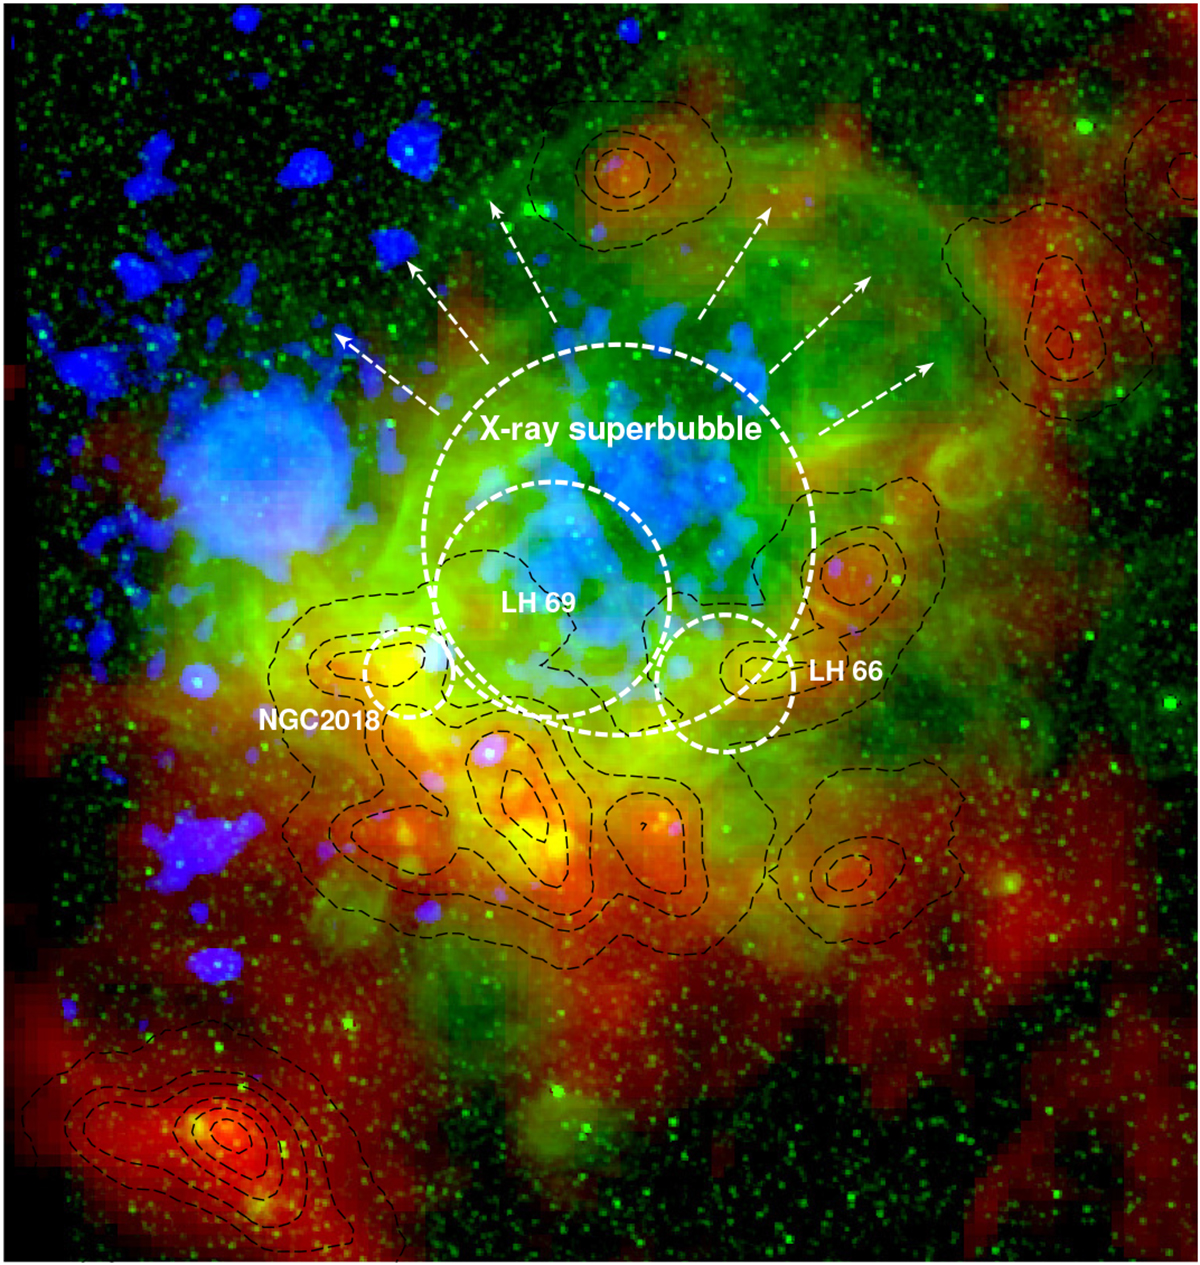
Color composite image of the N 206 complex, constructed from the Herschel spire data (red: 500 μm), Hα (green: MCELS, Smith et al. 2005), and X-rays (blue: XMM-Newton 0.3−1 keV). CO intensity contours taken from the MAGMA survey are over-plotted to the image. The arrows suggest the possible leakage of hot gas from the X-ray superbubble.
Current usage metrics show cumulative count of Article Views (full-text article views including HTML views, PDF and ePub downloads, according to the available data) and Abstracts Views on Vision4Press platform.
Data correspond to usage on the plateform after 2015. The current usage metrics is available 48-96 hours after online publication and is updated daily on week days.
Initial download of the metrics may take a while.