Fig. 18
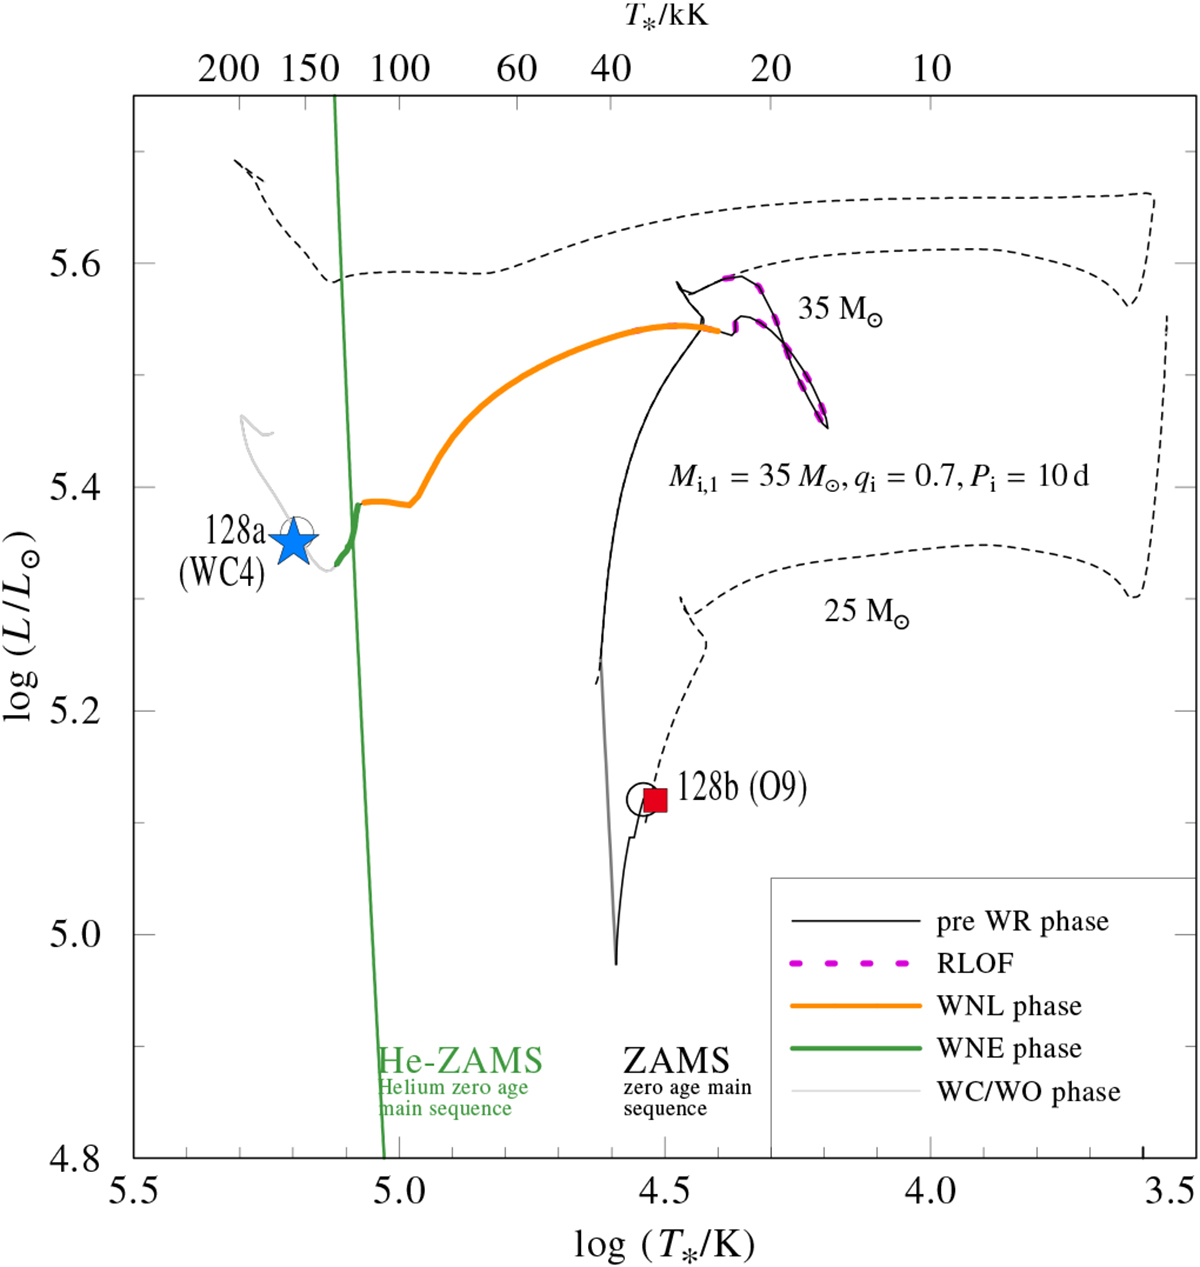
HRD positions of N206-FS 128a (WC4, blue asterisk) and N206-FS 128b (O9, red square). The solid lines represent binary evolutionary tracks from Eldridge et al. (2008) for the respective components. The circles denote the best-fitting positions along the tracks after 6 Myr of evolution. For comparison, the dashed lines show how the components would evolve without mutual interaction. See text for more details.
Current usage metrics show cumulative count of Article Views (full-text article views including HTML views, PDF and ePub downloads, according to the available data) and Abstracts Views on Vision4Press platform.
Data correspond to usage on the plateform after 2015. The current usage metrics is available 48-96 hours after online publication and is updated daily on week days.
Initial download of the metrics may take a while.