Fig. 15
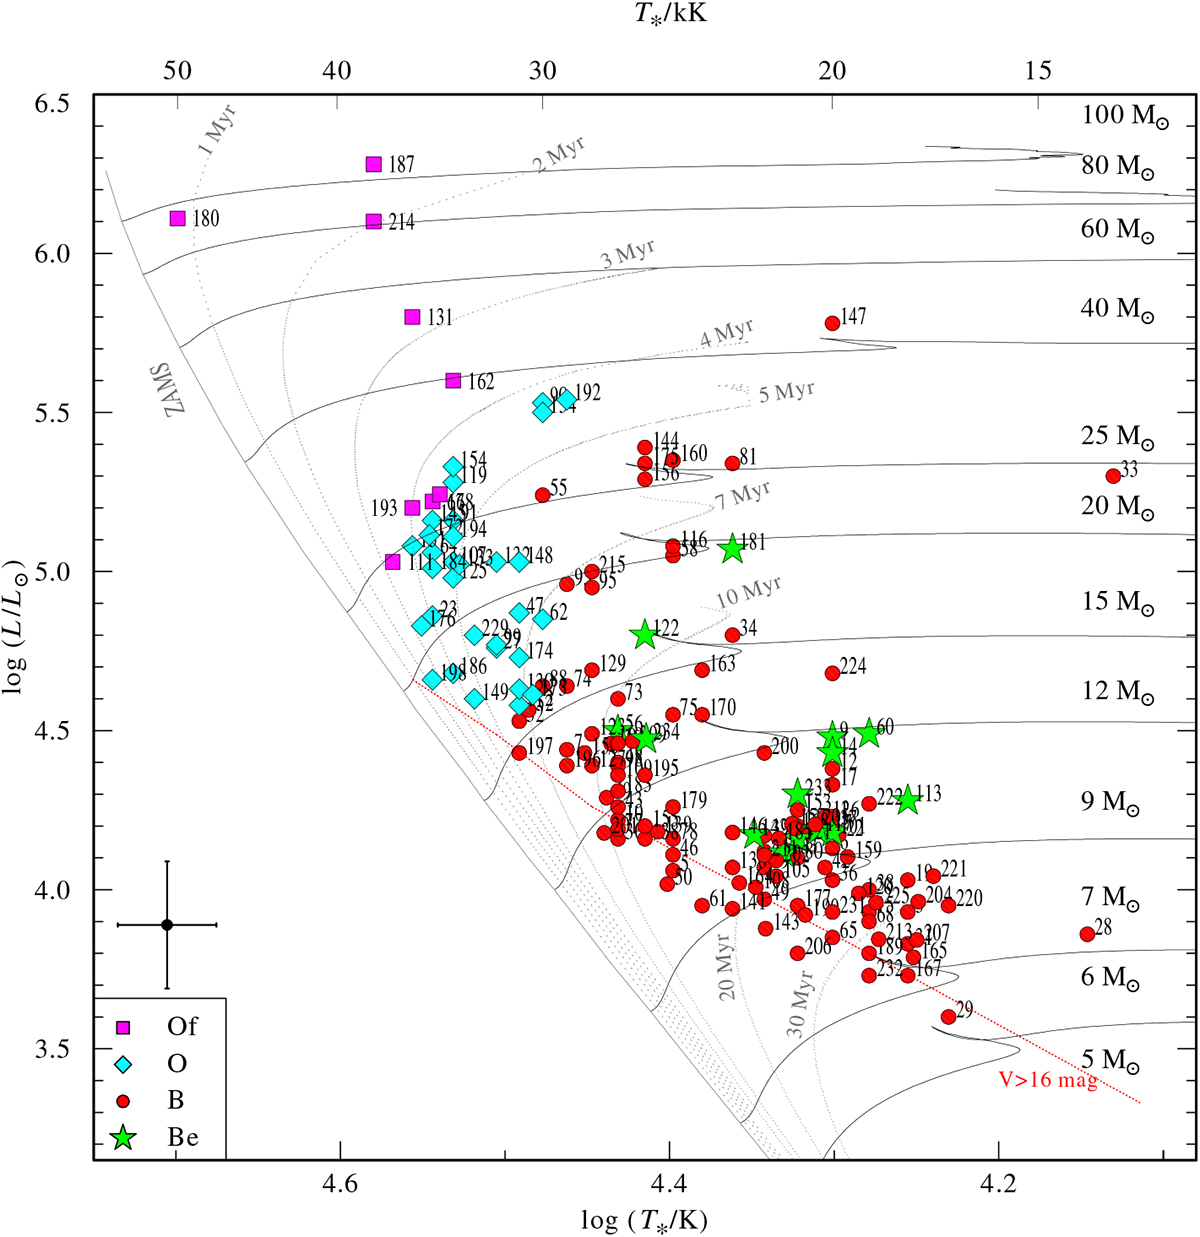
Hertzsprung–Russell diagram for OB stars in the N 206 superbubble in the LMC. The nine Of stars from Paper I are also included. The evolutionary tracks (thin solid lines) are labeled with their initial mass. Isochrones are represented by gray dotted lines. Tracks and isochrones are based on evolutionary models accounting for rotation with vrot,init ~ 100 km s−1 (Brott et al. 2011; Köhler et al. 2015). Different spectral types are distinguished by different colors and shapes of the symbols (see legend). The typical uncertainties of the stellar temperatures and luminosities are indicated by the error bars in the lower left of the HRD. The red dotted line represents the visual-magnitude cut-off of the observed sample.
Current usage metrics show cumulative count of Article Views (full-text article views including HTML views, PDF and ePub downloads, according to the available data) and Abstracts Views on Vision4Press platform.
Data correspond to usage on the plateform after 2015. The current usage metrics is available 48-96 hours after online publication and is updated daily on week days.
Initial download of the metrics may take a while.