Fig. 1
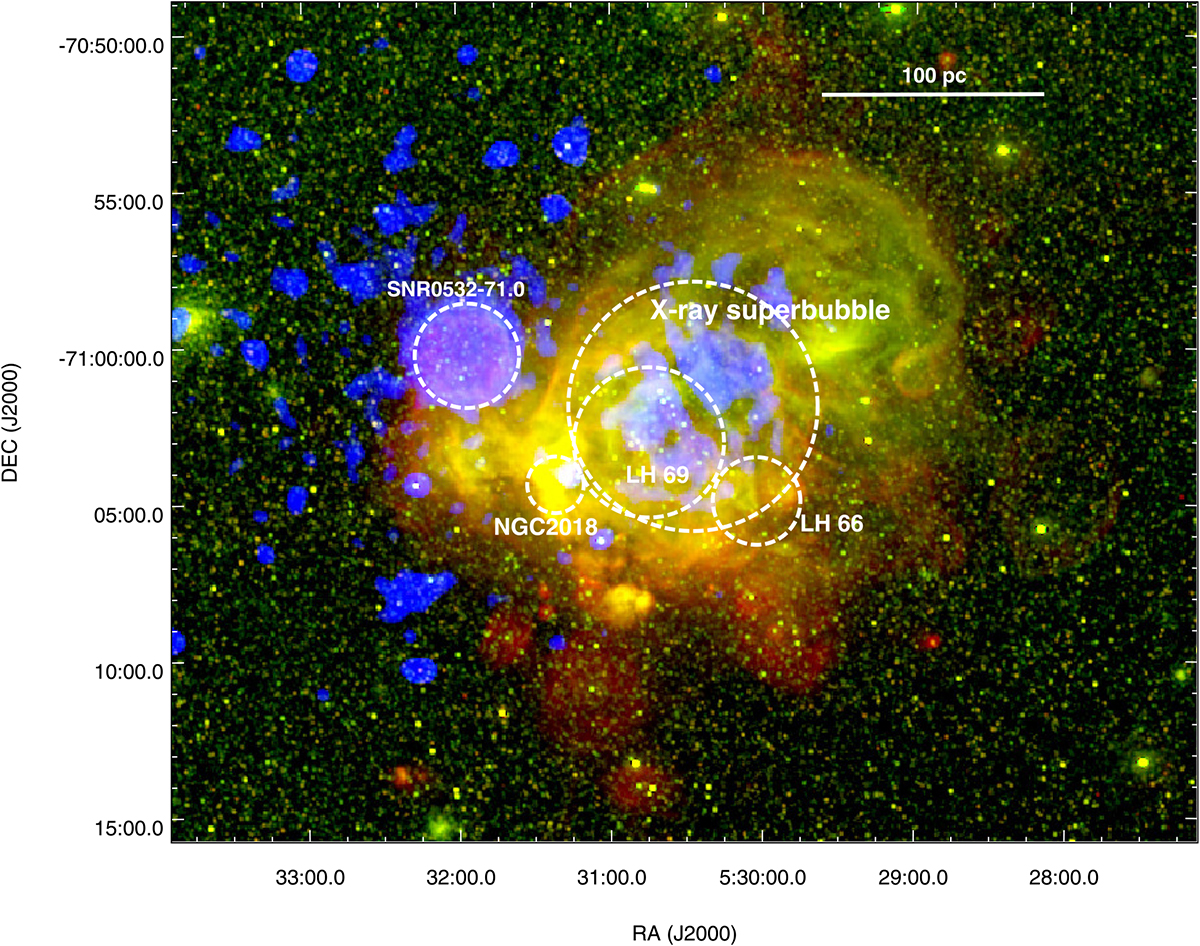
Location of the X-ray superbubble, SNR B0532−71.0, cluster NGC 2018, and OB associations LH 66 and LH 69 in the N 206 complex. The three-color composite image (Hα (red) + [O III] (green) + X-ray (blue)) shown in the background is from the Magellanic Cloud Emission-Line Survey (MCELS, Smith et al. 2005) and XMM-Newton (0.3-1 keV).
Current usage metrics show cumulative count of Article Views (full-text article views including HTML views, PDF and ePub downloads, according to the available data) and Abstracts Views on Vision4Press platform.
Data correspond to usage on the plateform after 2015. The current usage metrics is available 48-96 hours after online publication and is updated daily on week days.
Initial download of the metrics may take a while.