Fig. 1.
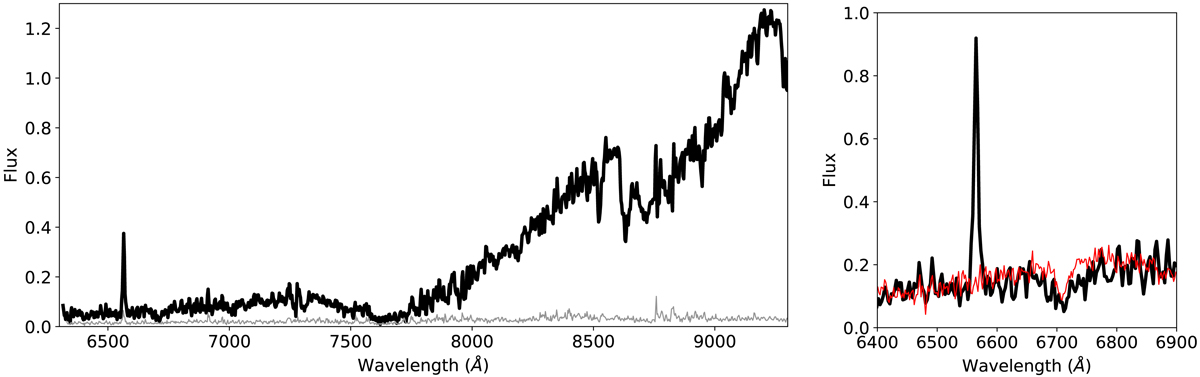
Full GTC/OSIRIS spectrum of the Hyades L5 dwarf 2M0418 (black) calibrated in flux with the standard deviation from the ten individual optical spectra (gray). The right-hand plot shows a zoom on Hα in emission and lithium in absorption. Overplotted in red is the optical spectrum of the field L5V dwarf 2MASS J12392727+5515371 which exhibit lithium in absorption (Kirkpatrick et al. 1999).
Current usage metrics show cumulative count of Article Views (full-text article views including HTML views, PDF and ePub downloads, according to the available data) and Abstracts Views on Vision4Press platform.
Data correspond to usage on the plateform after 2015. The current usage metrics is available 48-96 hours after online publication and is updated daily on week days.
Initial download of the metrics may take a while.