Fig. 3
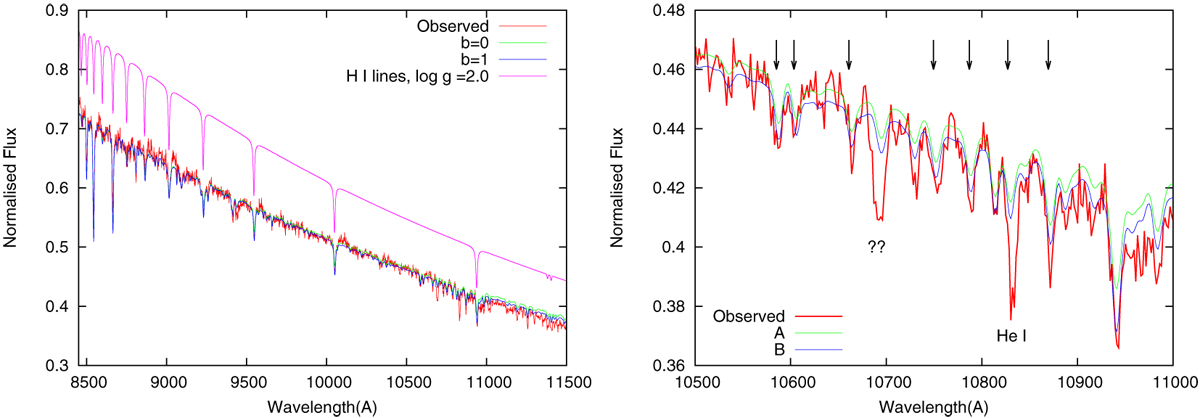
Left panel: best fit to the observed spectrum with b = 1 in the region of the Ca II triplet and He I; the case of b = 0 is also shown, as is the hydrogen line spectrum computed for a model atmosphere with log g = 2.0. Right panel:fit to the spectrum containing Si I lines, marked by vertical arrows; the He I line is also shown. We note the broad feature at 10 700 Å, marked by “??”; see text.
Current usage metrics show cumulative count of Article Views (full-text article views including HTML views, PDF and ePub downloads, according to the available data) and Abstracts Views on Vision4Press platform.
Data correspond to usage on the plateform after 2015. The current usage metrics is available 48-96 hours after online publication and is updated daily on week days.
Initial download of the metrics may take a while.