Open Access
Fig. 9
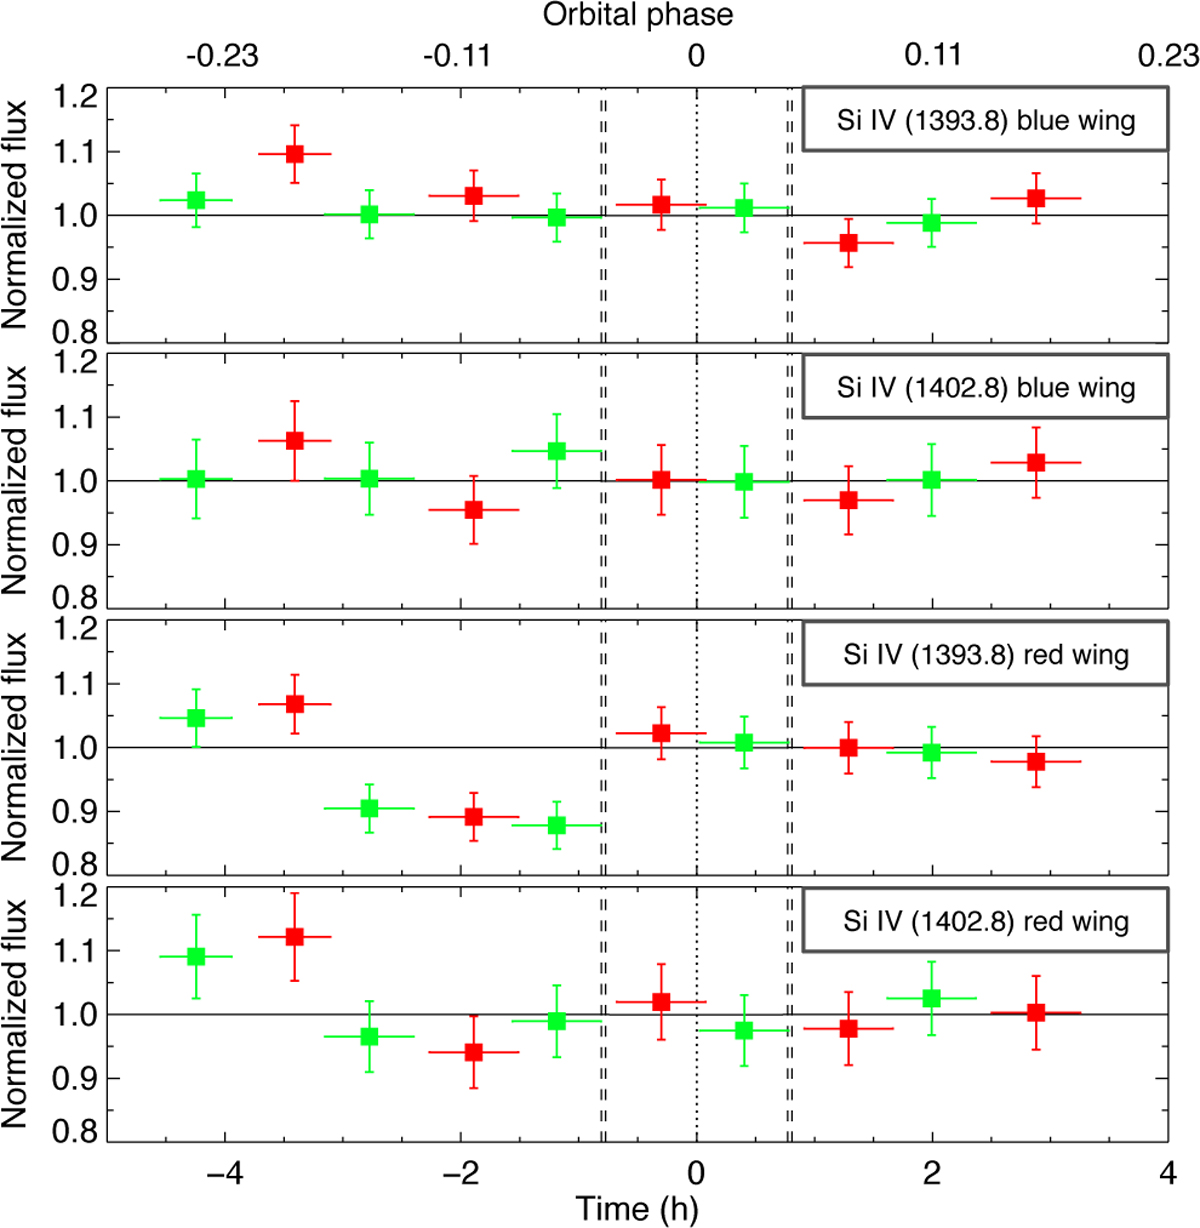
Flux integrated in the blue wing (upper panels) and red wing (lower panels) of the Si IV lines in Visit Bfuv (green) and Visit Cfuv (red). The absorption signature between –3 and –0.7 h is diluted when measured over the entire red wing. Fluxes are normalized by the mean of exposures obtained after –0.7 h (see text).
Current usage metrics show cumulative count of Article Views (full-text article views including HTML views, PDF and ePub downloads, according to the available data) and Abstracts Views on Vision4Press platform.
Data correspond to usage on the plateform after 2015. The current usage metrics is available 48-96 hours after online publication and is updated daily on week days.
Initial download of the metrics may take a while.