Fig. 7
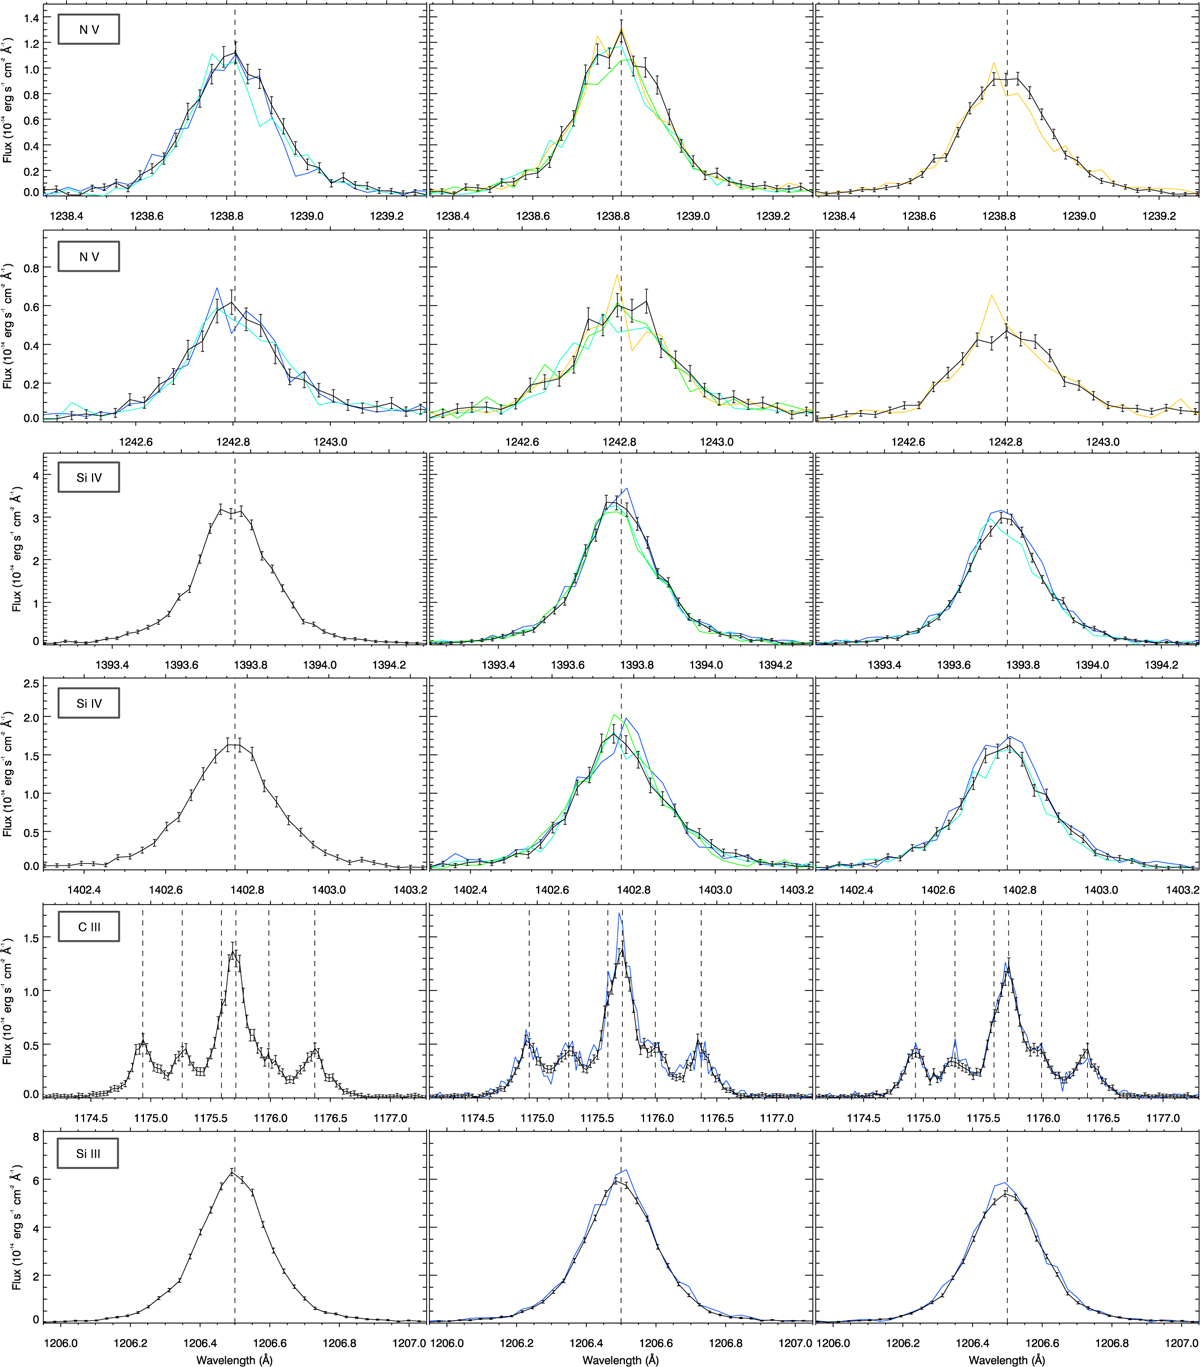
Spectral profiles of 55 Cnc FUV lines. Each row corresponds to a stellar line, ordered from top to bottom by decreasing formation temperature (Table 1). First to third columns correspond to visits Afuv, Bfuv, and Cfuv, respectively. Black profiles with error bars are the spectra taken as reference for the quiescent stellar lines, built by coadding stable spectra in each visit. Colored profiles correspond to spectra showing significant deviations from these references (exposures 0 to 4 in blue, cyan, green, orange, and red, respectively). All stellar lines have been corrected for their measured spectral shift and are thus centered on their rest wavelength (vertical dashed line).
Current usage metrics show cumulative count of Article Views (full-text article views including HTML views, PDF and ePub downloads, according to the available data) and Abstracts Views on Vision4Press platform.
Data correspond to usage on the plateform after 2015. The current usage metrics is available 48-96 hours after online publication and is updated daily on week days.
Initial download of the metrics may take a while.