Fig. 5
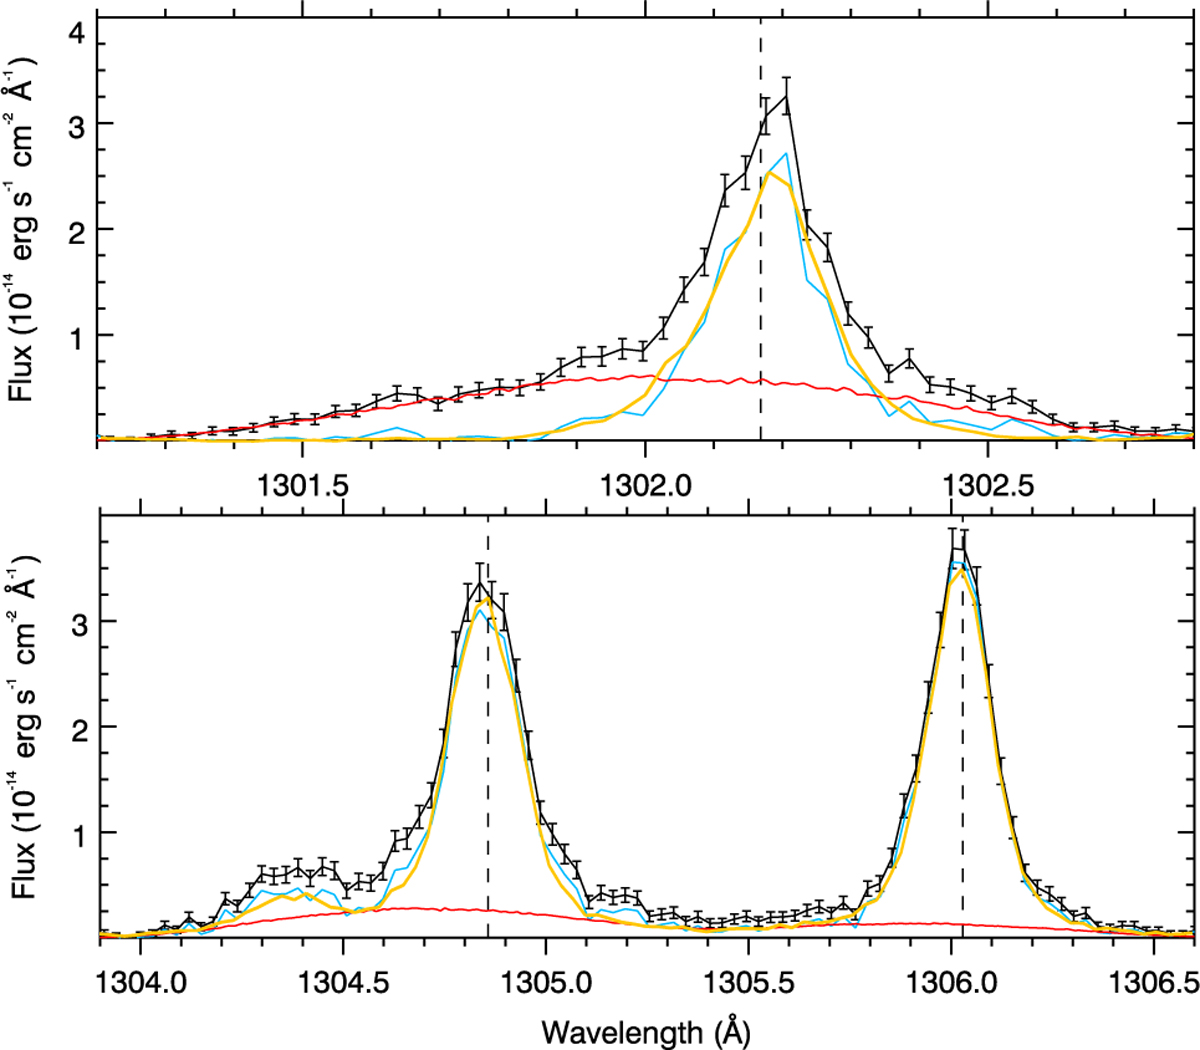
Spectrum observed in Visit Bfuv in the region of the O I triplet (average of the FP4 over the visit, in black). Blue spectra show the stellar lines corrected for contamination using airglow templates (red profiles). They are in good agreement with the airglow-free spectra (average of the FP1,2,3 over the visit, in orange). The stellar lines have been centered in the star rest frame (dashed black line).
Current usage metrics show cumulative count of Article Views (full-text article views including HTML views, PDF and ePub downloads, according to the available data) and Abstracts Views on Vision4Press platform.
Data correspond to usage on the plateform after 2015. The current usage metrics is available 48-96 hours after online publication and is updated daily on week days.
Initial download of the metrics may take a while.