Open Access
Fig. 4
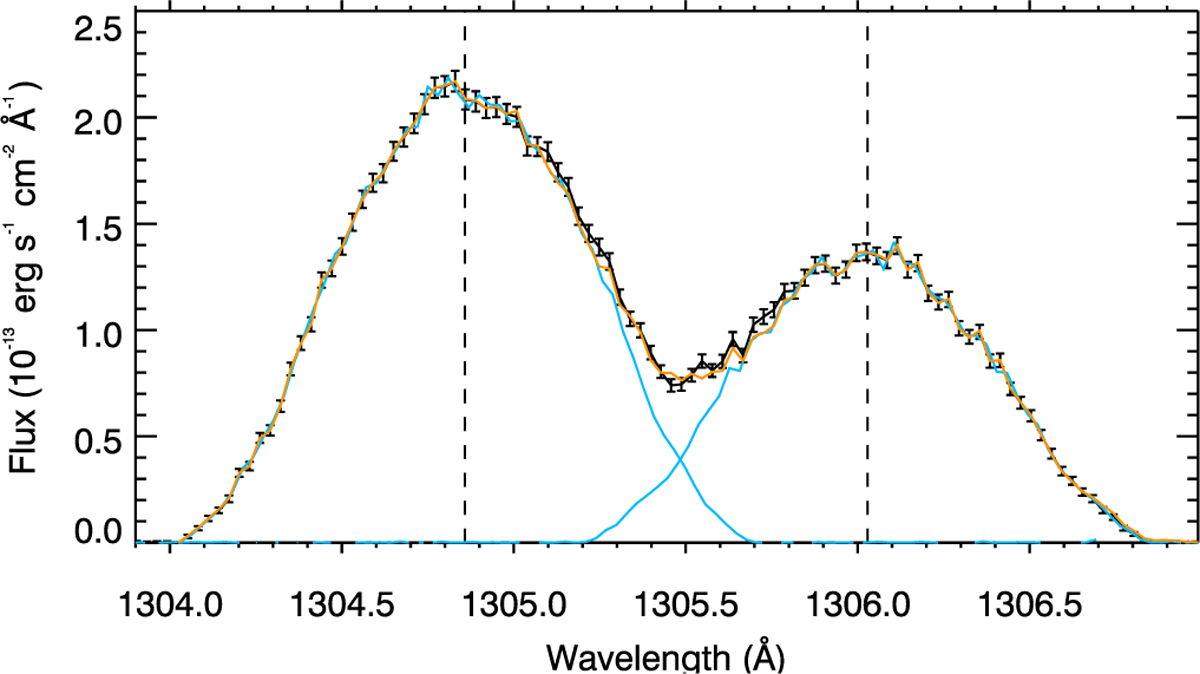
Geocoronal emission in the excited O Iair lines. The average of observed spectra (in black) was used to build individual templates for each line (in blue). The orange spectrum is the sum of the two templates, which fits well the blended parts of the lines.
Current usage metrics show cumulative count of Article Views (full-text article views including HTML views, PDF and ePub downloads, according to the available data) and Abstracts Views on Vision4Press platform.
Data correspond to usage on the plateform after 2015. The current usage metrics is available 48-96 hours after online publication and is updated daily on week days.
Initial download of the metrics may take a while.