Fig. 3
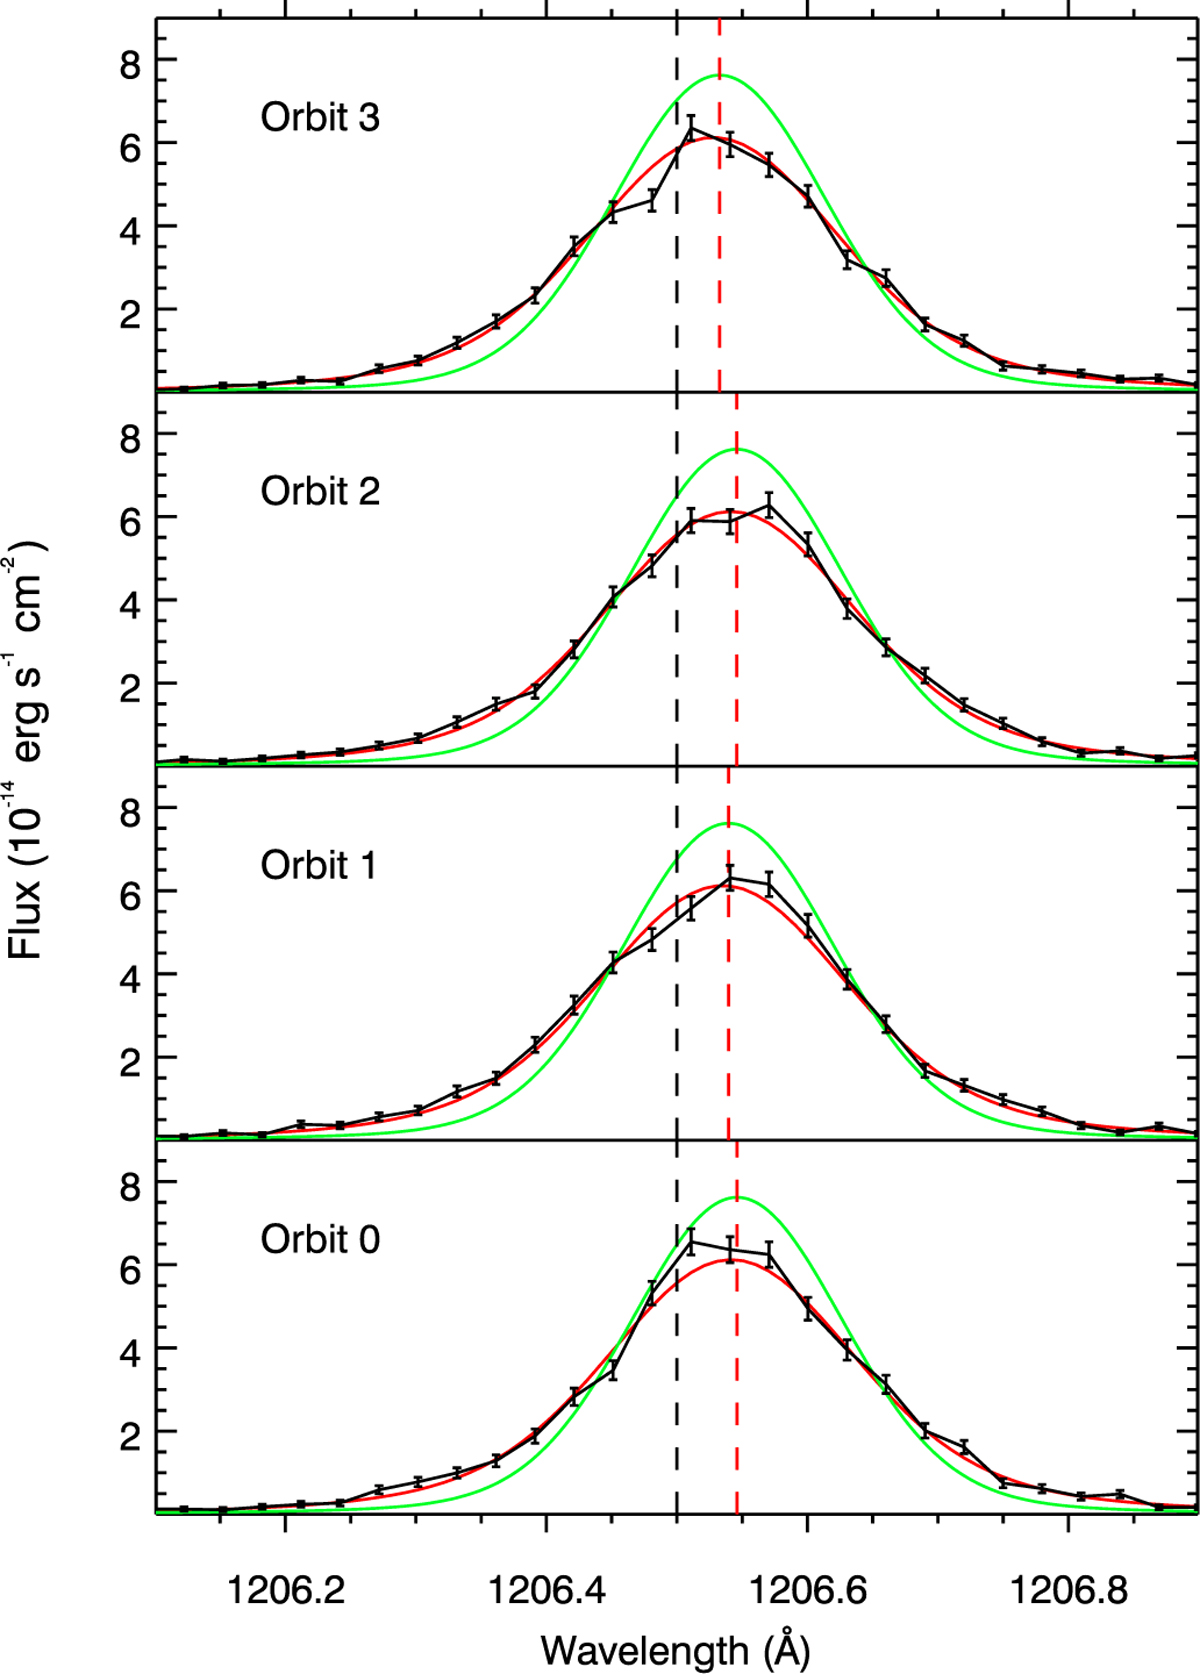
Si III line in Visit Afuv, plotted as a function of wavelength in the expected star rest frame. The green line shows the theoretical profile for the intrinsic stellar line, which is convolved with COS LSF (yielding the red spectra) to be compared to the observations (black spectra). The dashed black line shows the expected rest wavelength of the stellar line, and the dashed red line its measured central wavelength. We note that COS LSFs are asymmetrical and off-centered, hence the observed stellar lines are slightly distorted compared to the intrinsic lines.
Current usage metrics show cumulative count of Article Views (full-text article views including HTML views, PDF and ePub downloads, according to the available data) and Abstracts Views on Vision4Press platform.
Data correspond to usage on the plateform after 2015. The current usage metrics is available 48-96 hours after online publication and is updated daily on week days.
Initial download of the metrics may take a while.