Fig. 16
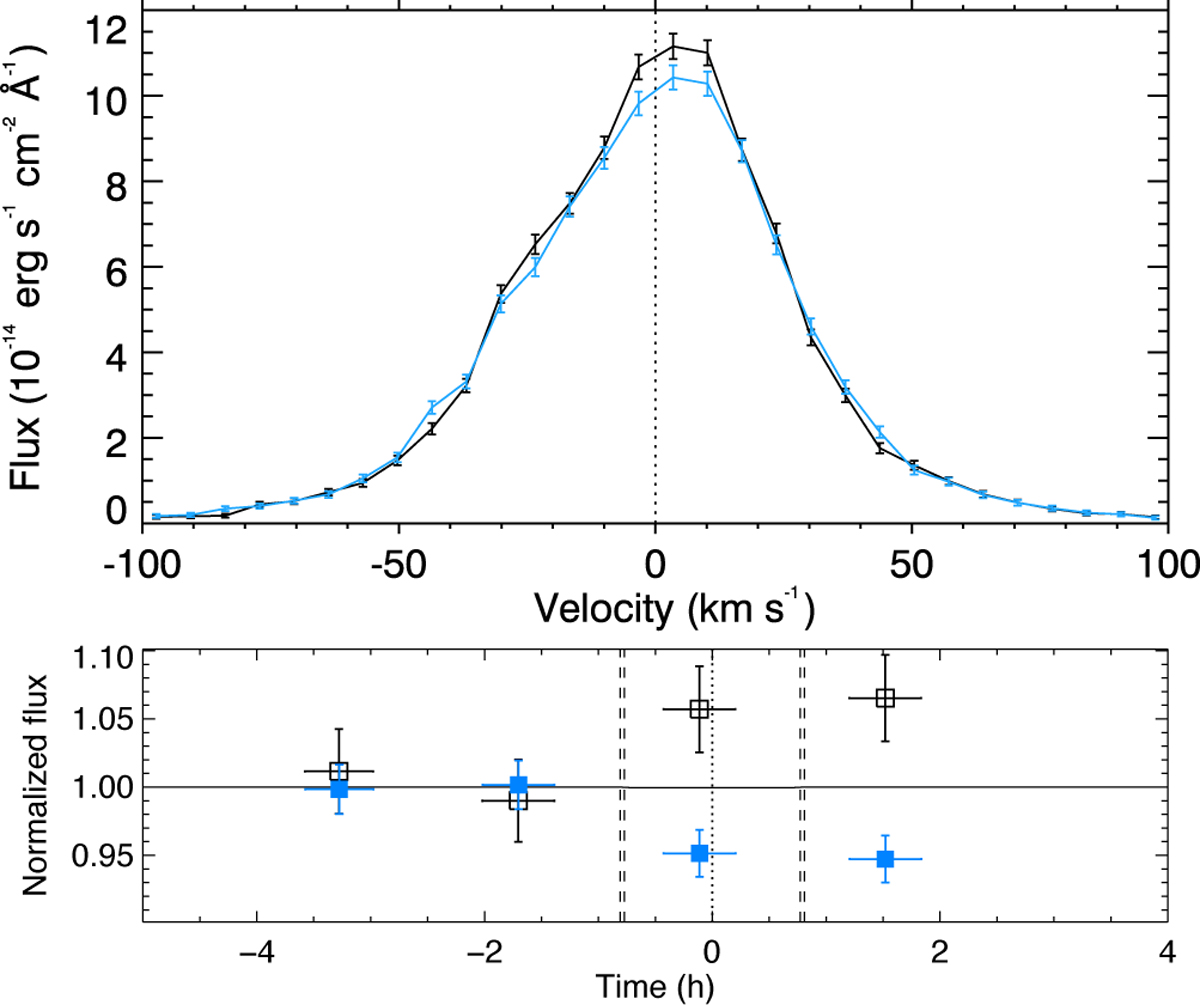
C II doublet in Visit Afuv. Upper panel:Coaddition of the λ1334.5 and λ1335.7 lines in velocity space. The comparison of the pre-transit mean spectrum (black) with the averaged in- and post-transit spectra (blue) reveals a flux decrease in the doublet core and a flux increase in its wings. Lower panel: Flux integrated over the absorbed velocity range –29 to 27 km s−1 (filled squares) and over the complementary range within –100 to 100 km s−1 (empty squares). Fluxes are normalized by the pre-transit values and plotted as a function of time relative to 55 Cnc e transit.
Current usage metrics show cumulative count of Article Views (full-text article views including HTML views, PDF and ePub downloads, according to the available data) and Abstracts Views on Vision4Press platform.
Data correspond to usage on the plateform after 2015. The current usage metrics is available 48-96 hours after online publication and is updated daily on week days.
Initial download of the metrics may take a while.