Fig. 13
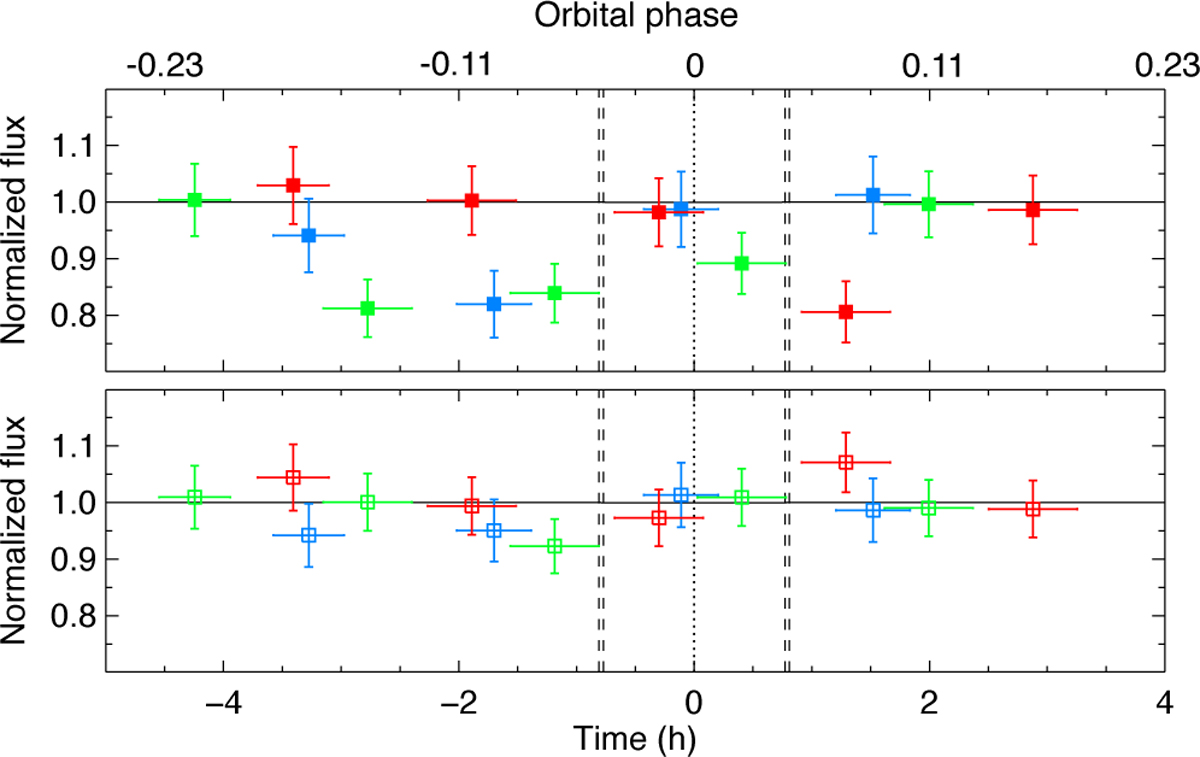
Upper panel: flux in the N V λ1238.8 line, integrated over the velocity range –3 and 31 km s−1, persistently absorbed in visits Afuv (blue), Bfuv (green), and Cfuv (red). Lower panel: Flux integrated over the complementary of the absorbed range within –100 to 100 km s−1. Fluxes are normalized using the stable reference spectra in each visit (see text) and plotted as a function of time relative to 55 Cnc e transit.
Current usage metrics show cumulative count of Article Views (full-text article views including HTML views, PDF and ePub downloads, according to the available data) and Abstracts Views on Vision4Press platform.
Data correspond to usage on the plateform after 2015. The current usage metrics is available 48-96 hours after online publication and is updated daily on week days.
Initial download of the metrics may take a while.