Fig. 10
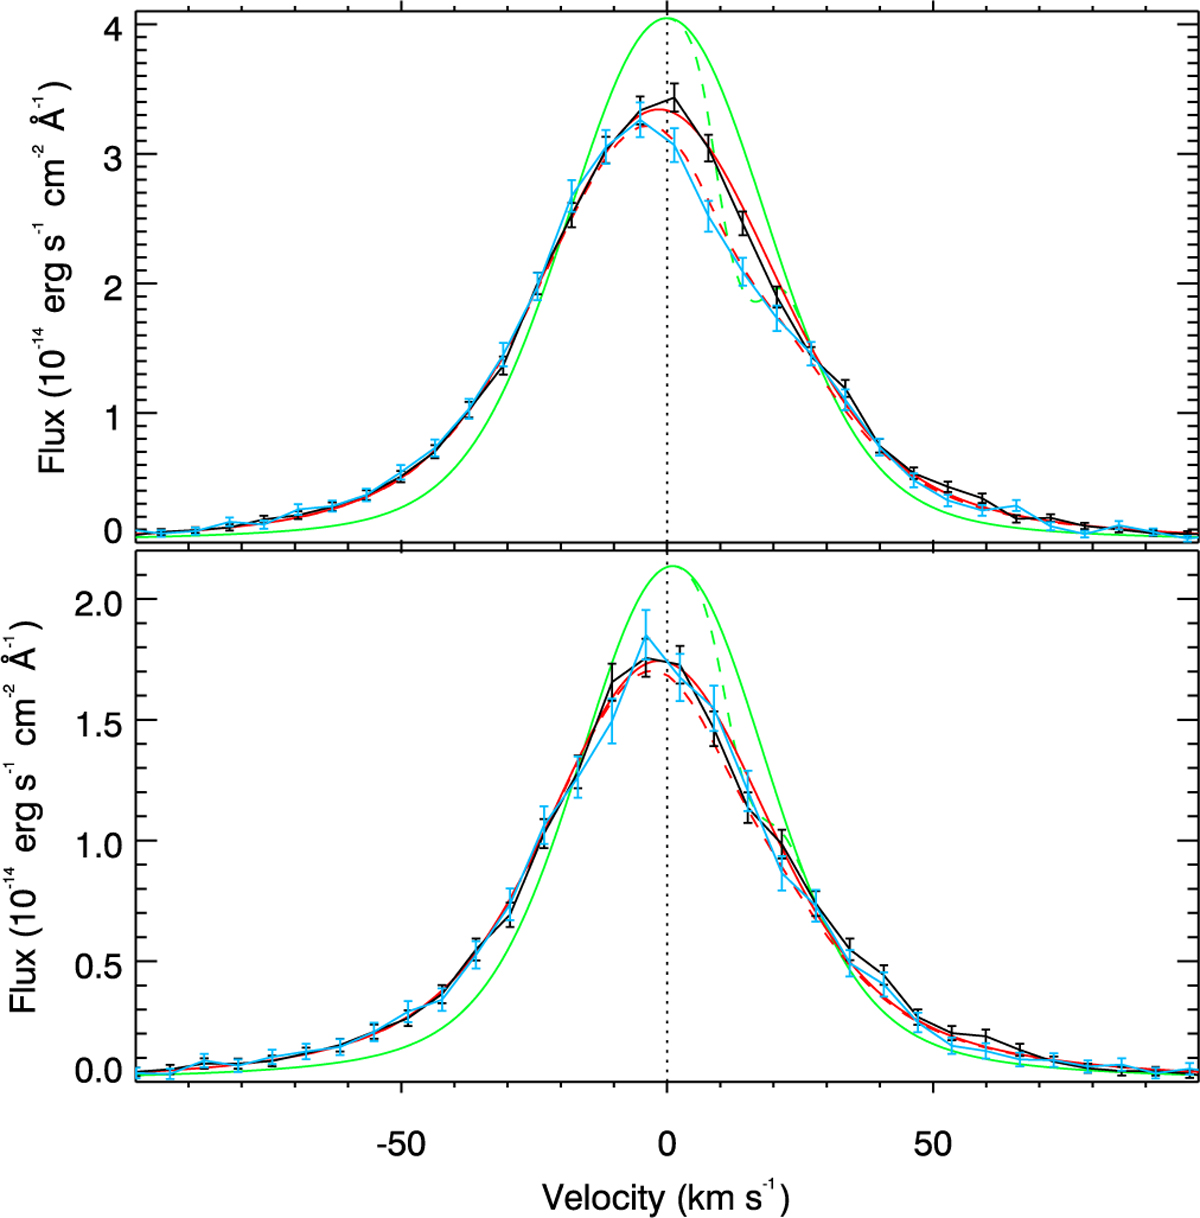
Si IV doublet averaged over visits Bfuv and Cfuv, as a function of velocity relative to the line centers (vertical dotted lines). The upper panel shows the Si IV λ1394 line. The lower panel shows the Si IV λ1403 line. Pre-transit spectra (blue) show a flux decrease compared to the in- and post-transit spectra (black), consistent with absorption from an optically thin cloud of ionized silicon gas. The green (before convolution) and red (after convolution) profiles correspond to a best-fit model for the intrinsic stellar line (solid line) and the occulting cloud (dashed line).
Current usage metrics show cumulative count of Article Views (full-text article views including HTML views, PDF and ePub downloads, according to the available data) and Abstracts Views on Vision4Press platform.
Data correspond to usage on the plateform after 2015. The current usage metrics is available 48-96 hours after online publication and is updated daily on week days.
Initial download of the metrics may take a while.