Fig. 8
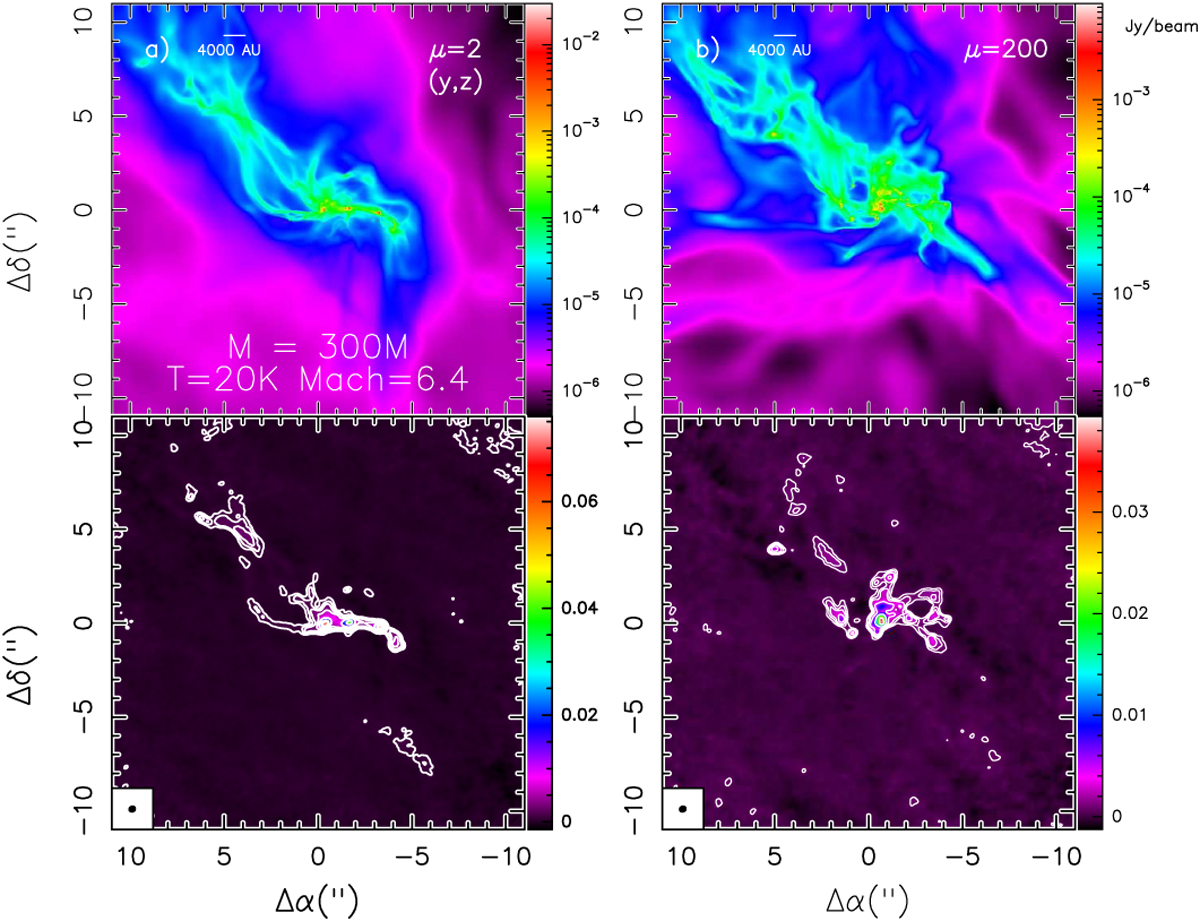
Simulations of the gravitational collapse of a 300 M⊙ collapsing clump, with gas temperature T = 20 K, and Mach number ![]() . a) Model predictions for the strongly magnetised case, μ = 2. In the top panel, we show the direct outcome of the simulations, while the same image processed with the CASA simulator is shown in the bottom panel. The first contour is 0.6 mJy beam−1 as in Fontani et al. (2016), roughly three times the 1σ rms of most images). The steps are 1.2, 2, 5, 10, 30, and 50 mJy beam−1. b) Same as (a) for the weakly magnetised case, μ = 130. These simulations have the same set of initial parameters as those discussed in Fontani et al. (2016), but we have post-processed and analysed those at which the star formation efficiency (SFE) is 15%, while Fontani et al. (2016) analysed the time at which the SFE matched that of IRAS 16061−5048c1 (~ 30%).
. a) Model predictions for the strongly magnetised case, μ = 2. In the top panel, we show the direct outcome of the simulations, while the same image processed with the CASA simulator is shown in the bottom panel. The first contour is 0.6 mJy beam−1 as in Fontani et al. (2016), roughly three times the 1σ rms of most images). The steps are 1.2, 2, 5, 10, 30, and 50 mJy beam−1. b) Same as (a) for the weakly magnetised case, μ = 130. These simulations have the same set of initial parameters as those discussed in Fontani et al. (2016), but we have post-processed and analysed those at which the star formation efficiency (SFE) is 15%, while Fontani et al. (2016) analysed the time at which the SFE matched that of IRAS 16061−5048c1 (~ 30%).
Current usage metrics show cumulative count of Article Views (full-text article views including HTML views, PDF and ePub downloads, according to the available data) and Abstracts Views on Vision4Press platform.
Data correspond to usage on the plateform after 2015. The current usage metrics is available 48-96 hours after online publication and is updated daily on week days.
Initial download of the metrics may take a while.