Fig. B.2
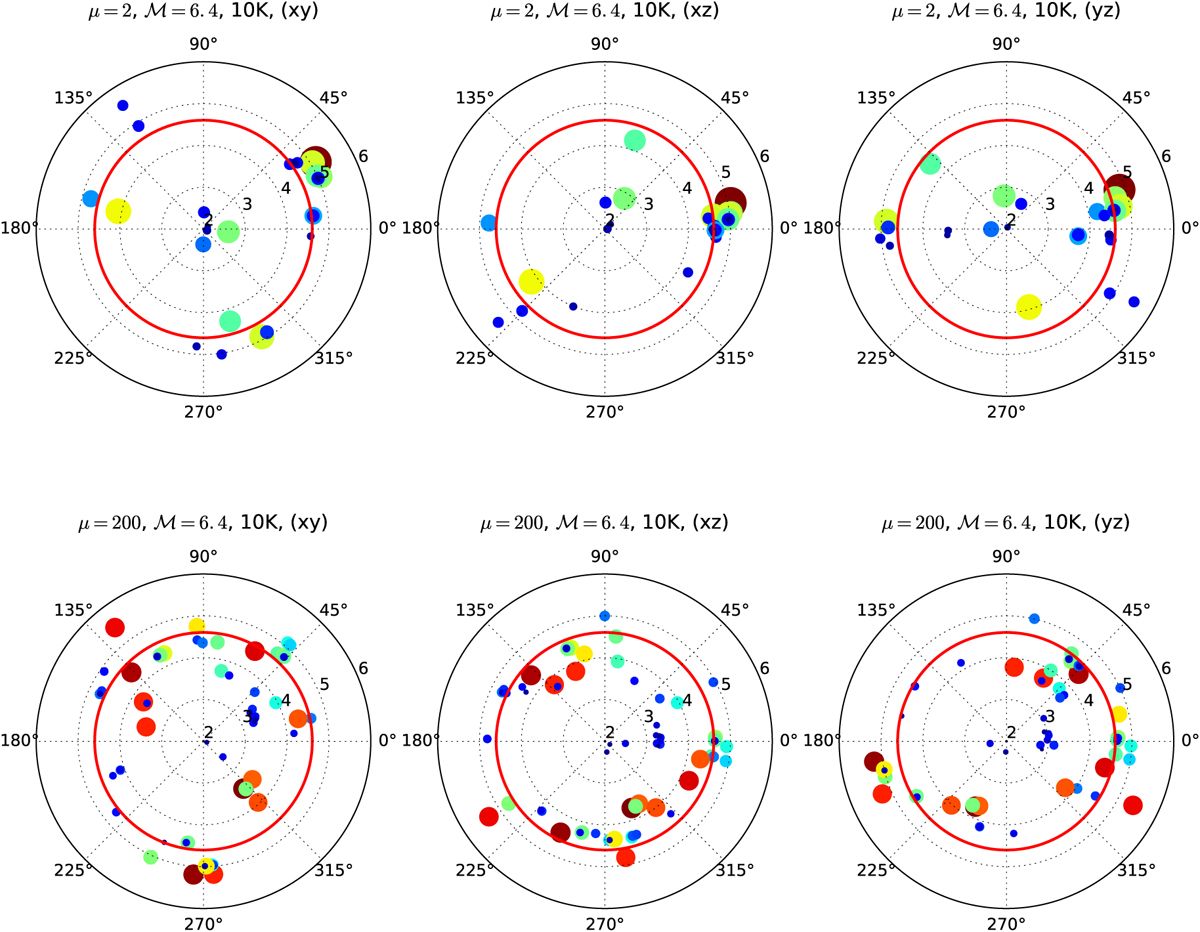
Projected sink particle distribution centered around the most massive sink particles at an SFE of 15% for simulations (3) (![]() , T = 10 K). The radial direction shows the distance in au in logarithmic scale. The red circle represents the size of the region that we post-processed with CASA to produce the ALMA synthetic observations.
, T = 10 K). The radial direction shows the distance in au in logarithmic scale. The red circle represents the size of the region that we post-processed with CASA to produce the ALMA synthetic observations.
Current usage metrics show cumulative count of Article Views (full-text article views including HTML views, PDF and ePub downloads, according to the available data) and Abstracts Views on Vision4Press platform.
Data correspond to usage on the plateform after 2015. The current usage metrics is available 48-96 hours after online publication and is updated daily on week days.
Initial download of the metrics may take a while.