Fig. 2
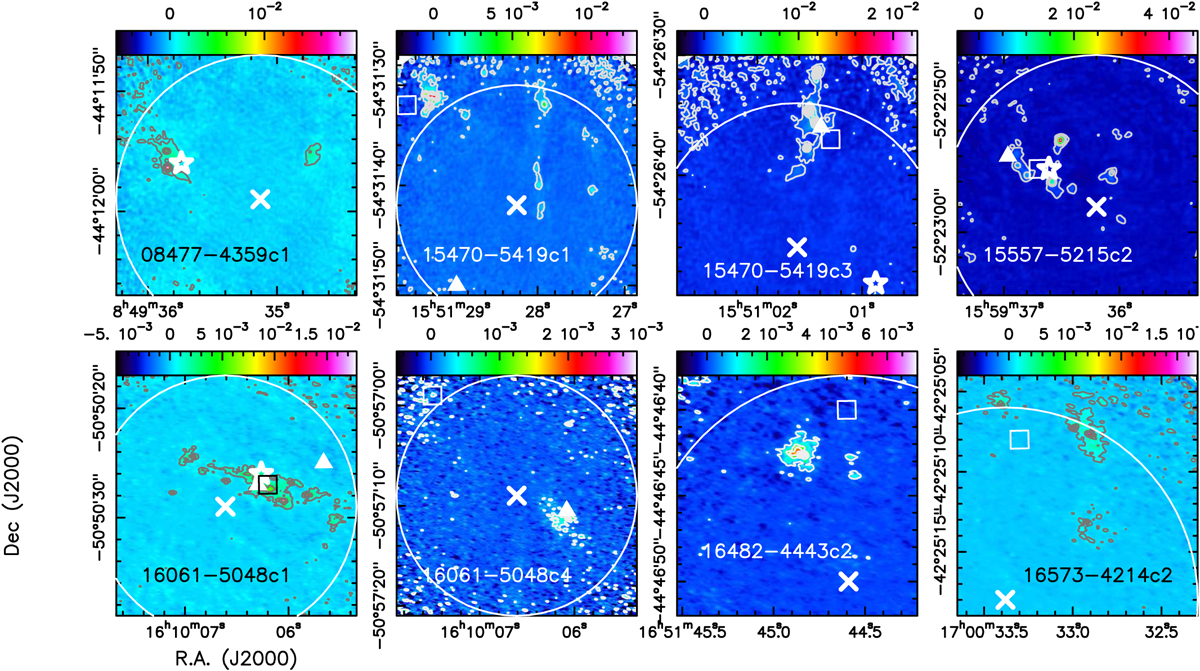
Dust thermal continuum emission maps (contours) at 278 GHz obtained with ALMA with an angular resolution of ~ 0.′′25 towards the eight targets. All images are primary beam corrected. The wedge at the top of each panel indicates the flux density scale(in Jy beam−1). The targetnames are reported at the bottom of each frame. Three targets were observed but not detected: 13039−6108c6, 15557−5215c3, and 16435−4515c3. Their maps are shown in Fig. 3. Contours start from the 3σ rms level and are in steps of 10–20σ rms, depending on the source. In each panel, the white circle indicates the ALMA field of view at 278 GHz (~24′′) centred on the single-dish millimeter continuum peak marked by the cross (Beltrán et al. 2006). The white stars show the possible Spitzer 24 μm continuum peak detected in the ALMA field of view (see Fig. 1), and the filled triangles pinpoint the position of the H2O maser spotsdetected towards some clumps (Giannetti et al. 2013). The square shows the emission peak detected in ATLASGAL, at ~870μm (Schuller et al. 2009; source 08477−4359c1 is not present in the ATLASGAL catalogue).
Current usage metrics show cumulative count of Article Views (full-text article views including HTML views, PDF and ePub downloads, according to the available data) and Abstracts Views on Vision4Press platform.
Data correspond to usage on the plateform after 2015. The current usage metrics is available 48-96 hours after online publication and is updated daily on week days.
Initial download of the metrics may take a while.