Fig. A.1
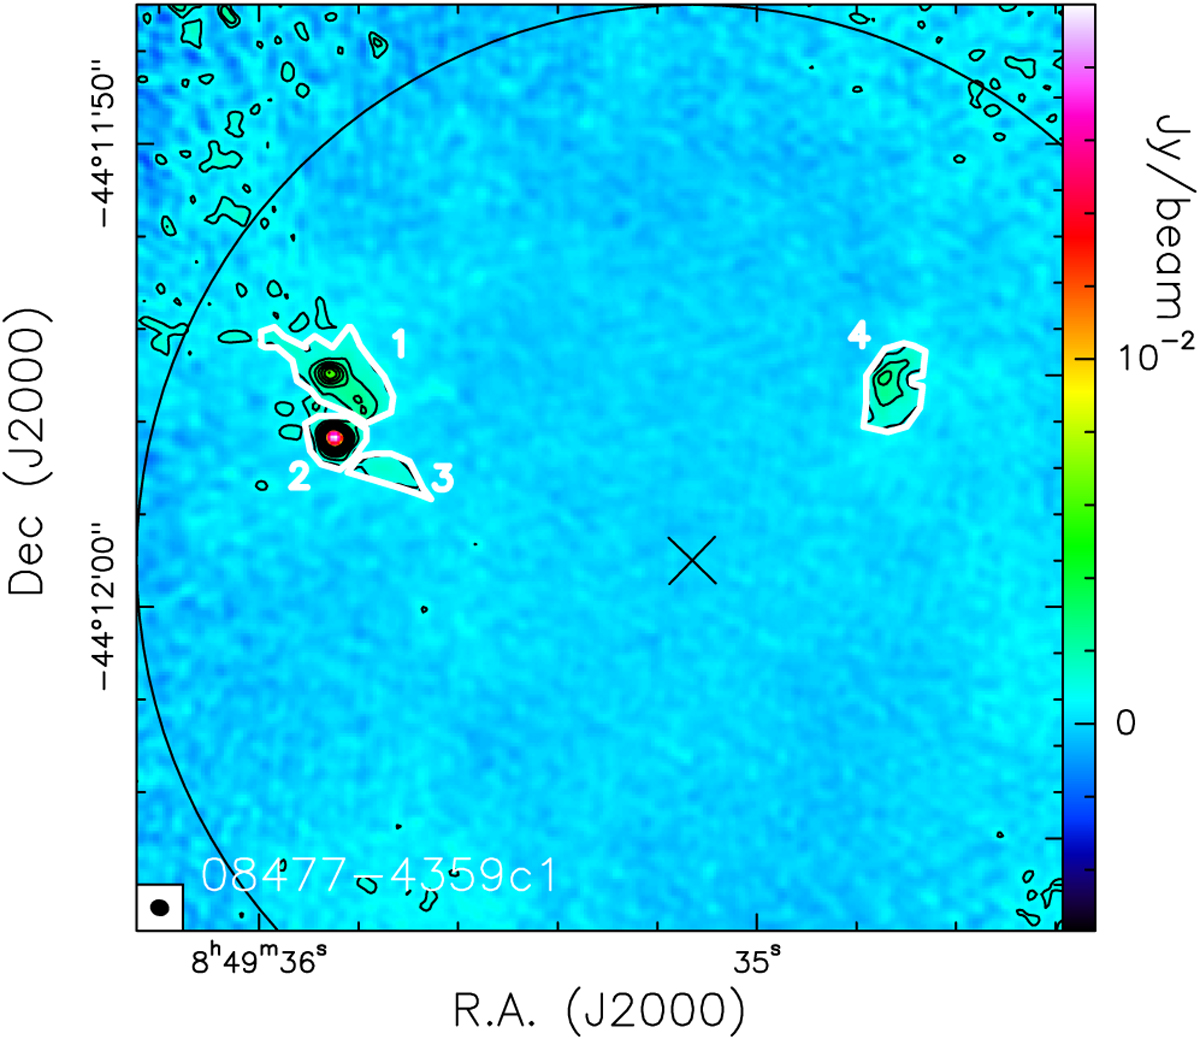
ALMA dust thermal continuum emission map at 278 GHz towards 08477−4359c1. The first contour level and the step is 8.7 × 10⁻⁴ Jy beam−1, corresponding to the 3σ rms noise level (1σ ~ 2.9 × 10⁻⁴ Jy beam−1). The white polygons indicate the fragments identified on the basis of the criteria described in Sect. 4. In each panel, the circle indicates the ALMA field of view at 278 GHz (~24′′), and the cross the phase centre, corresponding to the coordinates in Table 1.
Current usage metrics show cumulative count of Article Views (full-text article views including HTML views, PDF and ePub downloads, according to the available data) and Abstracts Views on Vision4Press platform.
Data correspond to usage on the plateform after 2015. The current usage metrics is available 48-96 hours after online publication and is updated daily on week days.
Initial download of the metrics may take a while.