Fig. 1
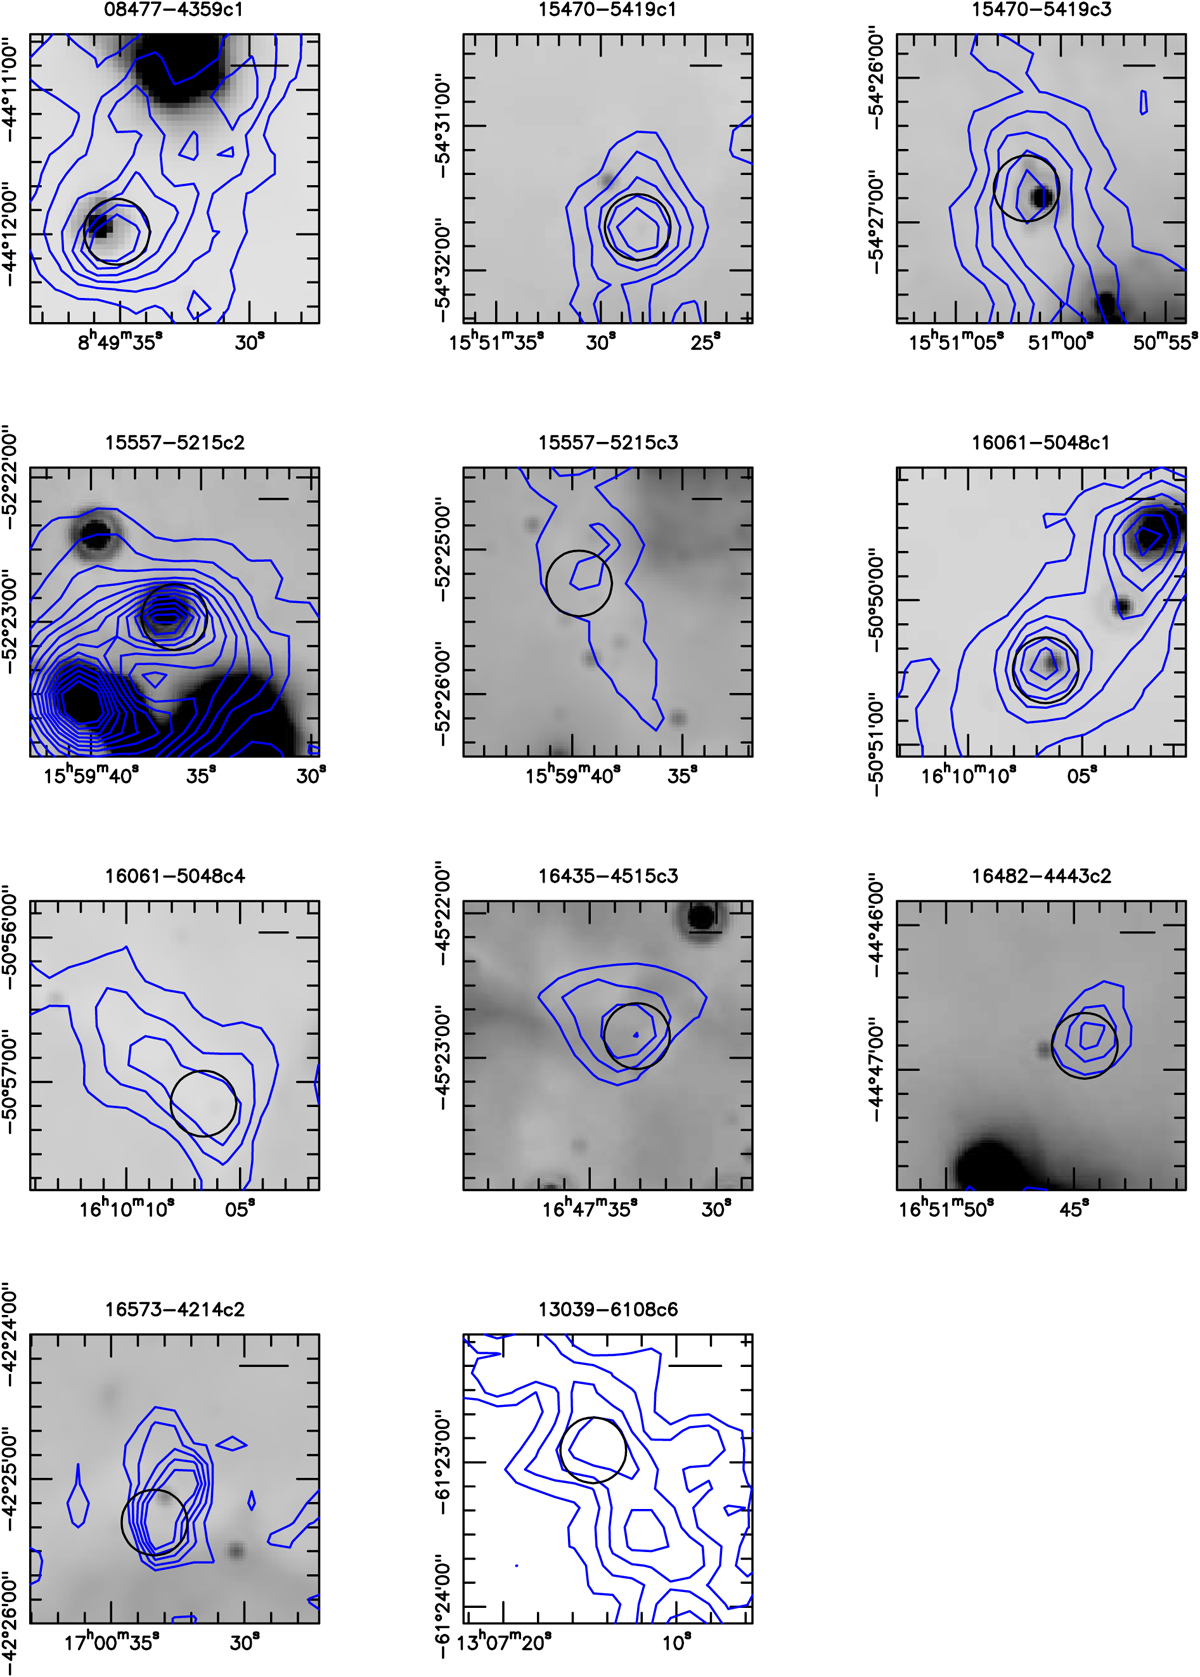
1.2 mm continuum maps (contours) obtained with SIMBA at the SEST towards the 11 sources in Table 1 that have an angular resolution of ~24′′. In each panel, the image in the background is the Spitzer-MIPS 24 μm map, which is available for all clumps except for 13039−6108c6, and the circle indicates the ALMA field of view at the frequency of the N2 H+ (3−2) line (~22′′) centred at the coordinates given in Table 1. The first contour and step correspond to the 3σ rms level in the map, with the exception of 16061−5048c1, in which the step is of 6σ rms (see Beltrán et al. 2006 for details). In each panel, the horizontal black bar in the top right corner shows a linear scale of 0.25 pc.
Current usage metrics show cumulative count of Article Views (full-text article views including HTML views, PDF and ePub downloads, according to the available data) and Abstracts Views on Vision4Press platform.
Data correspond to usage on the plateform after 2015. The current usage metrics is available 48-96 hours after online publication and is updated daily on week days.
Initial download of the metrics may take a while.